. 2013 Nov;6(7):1090-108.
doi: 10.1111/eva.12089. Epub 2013 Oct 9.

Assessing strategies to minimize unintended fitness consequences of aquaculture on wild populations

Affiliations

Assessing strategies to minimize unintended fitness consequences of aquaculture on wild populations

Marissa L Baskett et al. Evol Appl. 2013 Nov.

Abstract

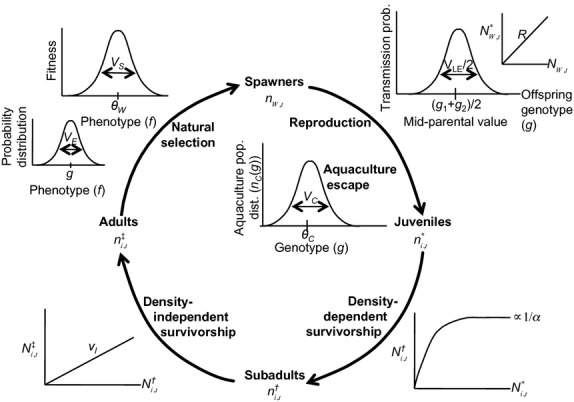
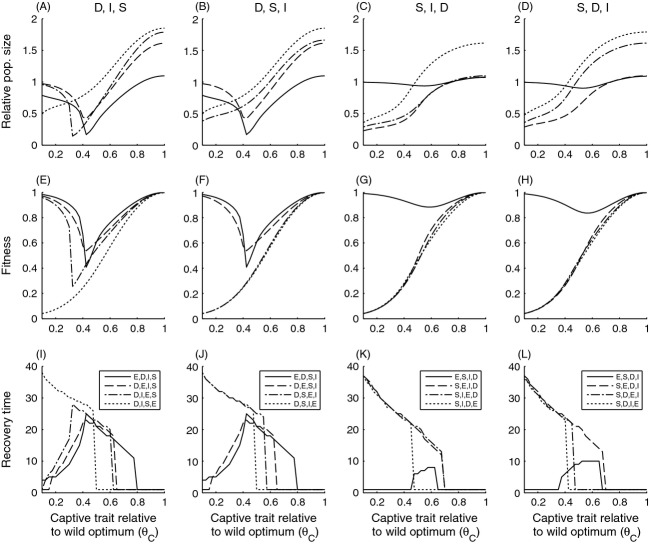
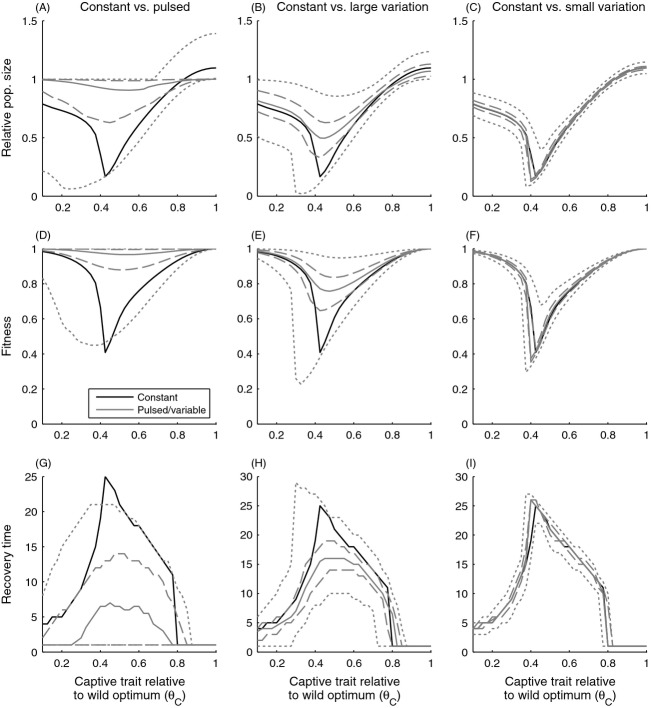
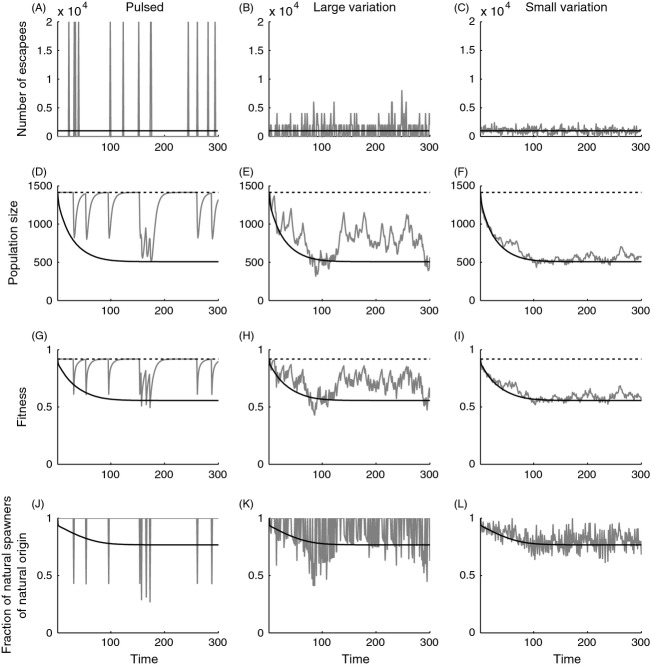
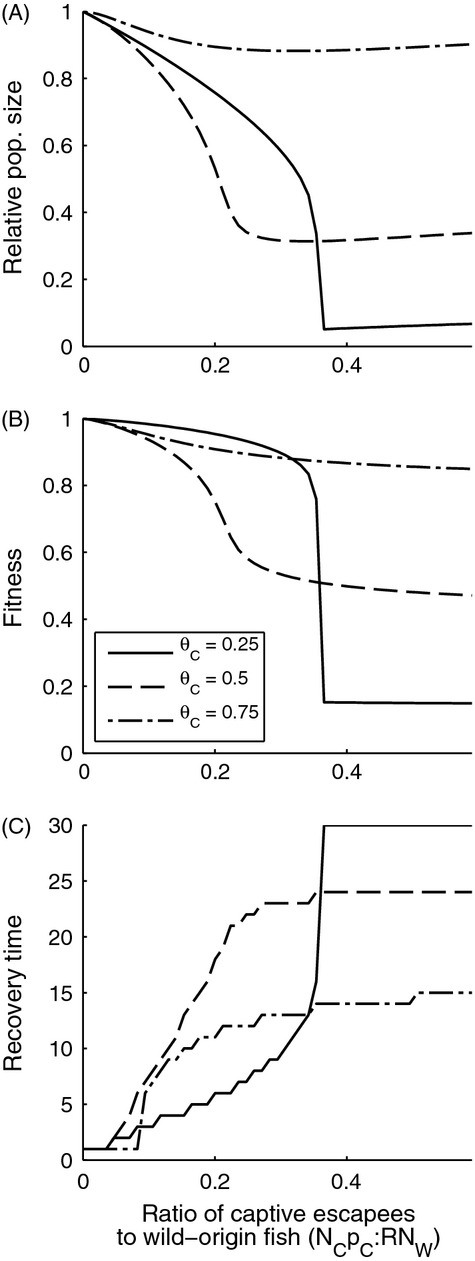
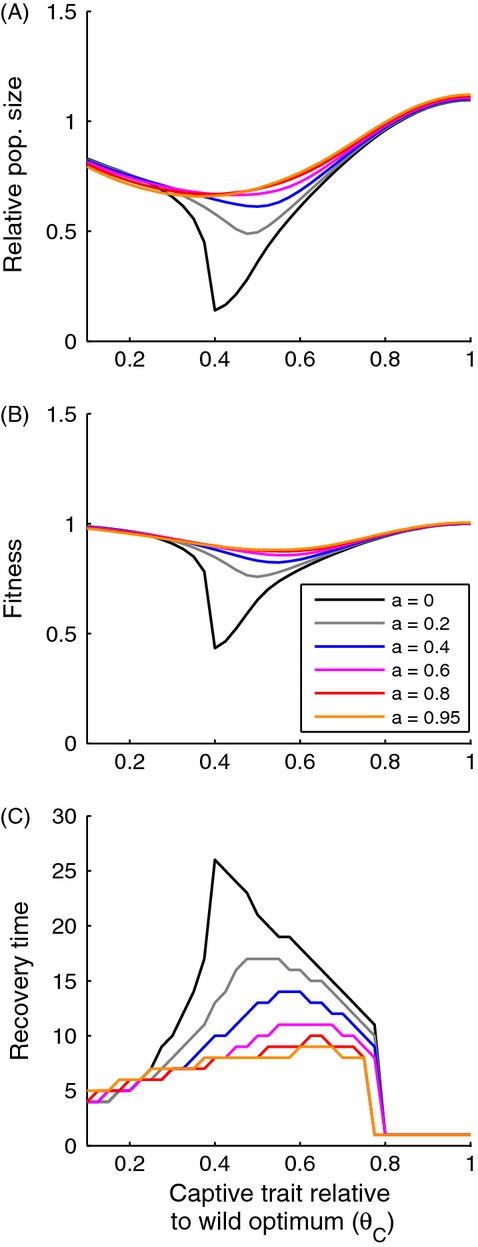
Artificial propagation programs focused on production, such as commercial aquaculture or forestry, entail strong domestication selection. Spillover from such programs can cause unintended fitness and demographic consequences for wild conspecifics. The range of possible management practices to minimize such consequences vary in their control of genetic and demographic processes. Here, we use a model of coupled genetic and demographic dynamics to evaluate alternative management approaches to minimizing unintended consequences of aquaculture escapees. We find that, if strong natural selection occurs between escape and reproduction, an extremely maladapted (i.e., nonlocal-origin, highly domesticated) stock could have fitness consequences analogous to a weakly diverged cultured stock; otherwise, wild population fitness declines with increasing maladaptation in the cultured stock. Reducing escapees through low-level leakage is more effective than reducing an analogous number of escapees from large, rare pulses. This result arises because low-level leakage leads to the continual lowering of wild population fitness and subsequent increased proportional contribution of maladapted cultured escapees to the total population. Increased sterilization efficacy can cause rapid, nonlinear reductions in unintended fitness consequences. Finally, sensitivity to the stage of escape indicates a need for improved monitoring data on how the number of escapees varies across life cycle stages.

Keywords: Salmo salar; aquaculture; contemporary evolution; domestication selection; migration load; quantitative genetic model.


Figures

Figure 1
Figure 1
Model illustration given the default life cycle order and aquaculture escape timing (eqns 1–7). Graphs illustrate the dynamics at each step, with one full cycle for each generation (stages indicated on the circle, wild population dynamics outside the circle, and aquaculture population dynamics inside the circle). See Table 1 for definitions of the parameters indicated. Model explorations include changing the order of aquaculture escape, density-dependent survival, density-independent survival, and natural selection.
Figure 2
Figure 2
The effect of escape timing and life cycle order: each column has a different sequence of events (D: density dependence, S: selection, I: density-independent mortality), and each line indicates a different escape time (E) within that sequence. We omit all orderings with density-independent mortality immediately following reproduction, as such simulations are mathematically equivalent to reducing the reproductive output R, to which we explore sensitivity. Here and in the remaining figures, population size (the first row) and fitness (the second row) are plotted relative to their respective baseline values without the cultured population, and recovery time (the third row) is in generations. For an indication of absolute values of population size and fitness, see Fig. A.1 in Appendix A.
Figure 3
Figure 3
Constant versus pulsed spillover: black lines indicate the outcome given constant, low-level spillover while gray lines give the outcome with stochastically variable spillover. For the variable spillover, the solid lines indicate the median outcome, dashed lines the 25th and 75th percentiles, and dotted lines the 1st and 99th percentiles of the data over multiple runs and generations (see Fig. 4 for example runs). The first column (panels A, D, G) indicates the pulsed case of either entire net-pen escape or no escapees, the second (panels B, E, H) and third (panels C, F, I) columns indicate the variable case with escapees drawn from a binomial distribution with 10 or 100 Bernoulli trials, respectively. For an explanation of y-axis values, see Figure 2.
Figure 4
Figure 4
Example time series given constant, pulsed, or variable spillover (with θC = 0.6). The first column shows pulsed escapes, and the second and third columns show stochastic escape with large and small variation around a constant mean, respectively. In each plot, the gray lines show the results for the pulsed/variable spillover and the black lines show the constant spillover. In the population size and fitness plots (second and third rows), the broken line indicates the baseline value without aquaculture. The fraction of natural spawners of natural origin (Waples et al. 2012) in the bottom row is calculated as formula image from the values in eqn 7.
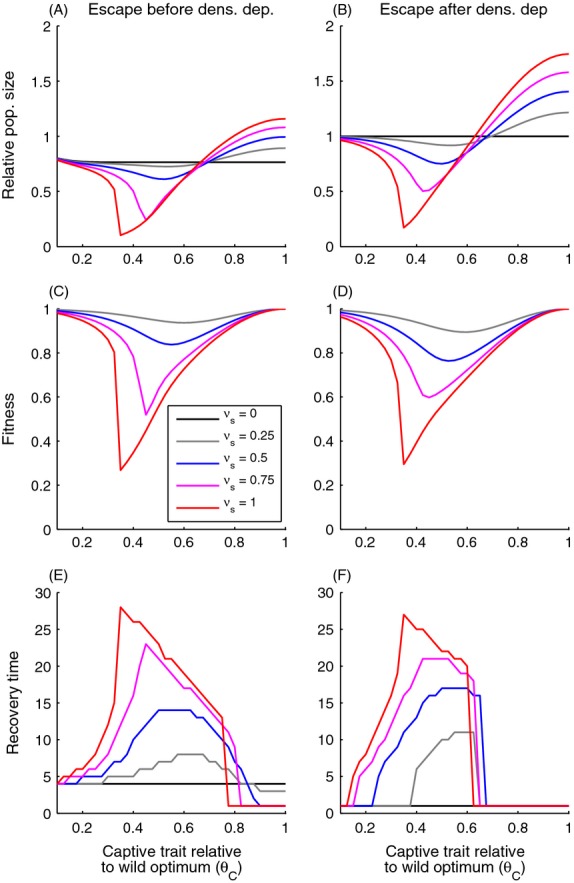
Figure 5
Figure 5
The effect of different values for the relative spawning success of aquaculture origin individuals, where νS = 0 indicates complete sterilization and 0 < νS < 1 can indicate the effect of imperfect sterilization. For an explanation of y-axis values, see Fig. 2.
Figure 6
Figure 6
Effect of different parameter values on fitness, plotted relative to the baseline fitness in equivalent simulations without aquaculture escapees. The broken lines indicates the outcome under default parameter values (Table 1), with the solid and dash-dotted lines indicating the effect of decreasing or increasing the value of the indicated parameter, while all others are held constant. Values for the variances in panels (B–D) are expressed relative to the value of the variance in the selection surface VS (inverse of selection strength). The equivalent plots for population size and recovery time are in Supplementary Information Appendix C.
Figure 7
Figure 7
Effect of the ratio of captive escapees to wild-origin fish (per generation) under different values for the mean aquaculture genotype (θC, relative to the wild optimum phenotype of θW = 1). The x-axis value of captive-origin:wild-origin population sizes is measured at escape. For an explanation of y-axis values, see Fig. 2.
Figure 8
Figure 8
Effect of the strength of assortative mating when included. We implement assortative mating with increasing mating likelihood for increasing phenotypic similarity, where the parameter a represents the phenotypic correlation of mating pairs. For an explanation of y-axis values, see Fig. 2.

References

    1. Araki H, Cooper B, Blouin MS. Genetic effects of captive breeding cause a rapid, cumulative fitness decline in the wild. Science. 2007;318:100–103. - PubMed
    1. Baskett M, Waples R. Evaluating alternative strategies for minimizing unintended fitness consequences of cultured individuals on wild populations. Conservation Biology. 2013;27:83–94. - PubMed
    1. Benfey T. The physiology and behavior of triploid fishes. Reviews in Fisheries Science. 1999;7:39–67.
    1. Burke J, Arnold M. Genetics and the fitness of hybrids. Annual Review of Genetics. 2001;35:31–52. - PubMed
    1. Coulson T, Tuljapurkar S, Childs DZ. Using evolutionary demography to link life history theory, quantitative genetics and population ecology. Journal of Animal Ecology. 2010;79:1226–1240. - PMC - PubMed