

Identification of ultramodified proteins using top-down tandem mass spectra
- PMID: 24188097
- PMCID: PMC3905687
- DOI: 10.1021/pr400849y
Identification of ultramodified proteins using top-down tandem mass spectra
Abstract
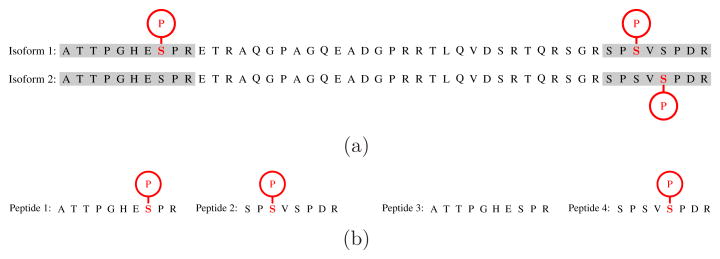
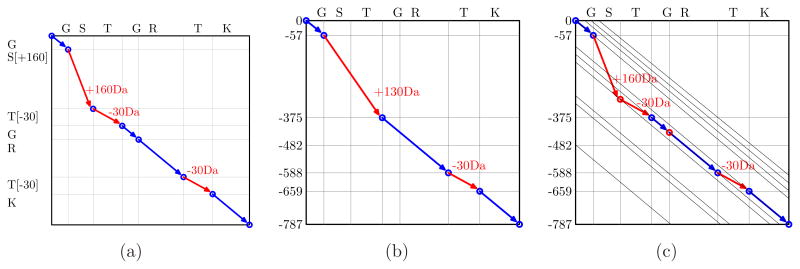
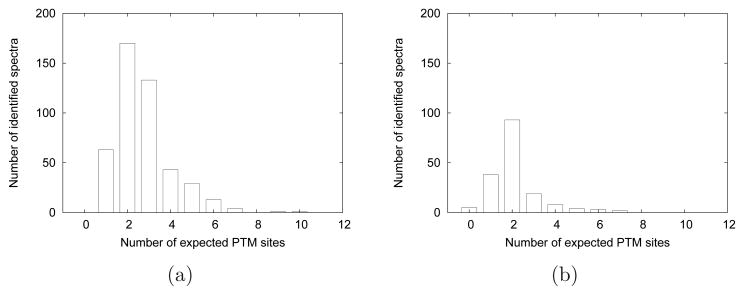
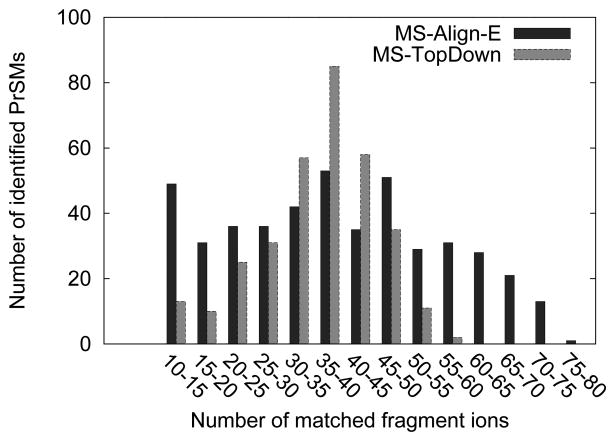
Post-translational modifications (PTMs) play an important role in various biological processes through changing protein structure and function. Some ultramodified proteins (like histones) have multiple PTMs forming PTM patterns that define the functionality of a protein. While bottom-up mass spectrometry (MS) has been successful in identifying individual PTMs within short peptides, it is unable to identify PTM patterns spreading along entire proteins in a coordinated fashion. In contrast, top-down MS analyzes intact proteins and reveals PTM patterns along the entire proteins. However, while recent advances in instrumentation have made top-down MS accessible to many laboratories, most computational tools for top-down MS focus on proteins with few PTMs and are unable to identify complex PTM patterns. We propose a new algorithm, MS-Align-E, that identifies both expected and unexpected PTMs in ultramodified proteins. We demonstrate that MS-Align-E identifies many proteoforms of histone H4 and benchmark it against the currently accepted software tools.
Figures
Similar articles
-
A graph-based approach for proteoform identification and quantification using top-down homogeneous multiplexed tandem mass spectra.BMC Bioinformatics. 2018 Aug 13;19(Suppl 9):280. doi: 10.1186/s12859-018-2273-4. BMC Bioinformatics. 2018. PMID: 30367573 Free PMC article.
-
Characterization of Proteoform Post-Translational Modifications by Top-Down and Bottom-Up Mass Spectrometry in Conjunction with Annotations.J Proteome Res. 2023 Oct 6;22(10):3178-3189. doi: 10.1021/acs.jproteome.3c00207. Epub 2023 Sep 20. J Proteome Res. 2023. PMID: 37728997 Free PMC article.
-
Top-down characterization of chicken core histones.J Proteomics. 2018 Jul 30;184:34-38. doi: 10.1016/j.jprot.2018.06.007. Epub 2018 Jun 20. J Proteomics. 2018. PMID: 29935335
-
Software eyes for protein post-translational modifications.Mass Spectrom Rev. 2015 Mar-Apr;34(2):133-47. doi: 10.1002/mas.21425. Epub 2014 Jun 2. Mass Spectrom Rev. 2015. PMID: 24889695 Review.
-
Identification, Quantification, and Site Localization of Protein Posttranslational Modifications via Mass Spectrometry-Based Proteomics.Adv Exp Med Biol. 2016;919:345-382. doi: 10.1007/978-3-319-41448-5_17. Adv Exp Med Biol. 2016. PMID: 27975226 Review.
Cited by
-
A graph-based approach for proteoform identification and quantification using top-down homogeneous multiplexed tandem mass spectra.BMC Bioinformatics. 2018 Aug 13;19(Suppl 9):280. doi: 10.1186/s12859-018-2273-4. BMC Bioinformatics. 2018. PMID: 30367573 Free PMC article.
-
A mass graph-based approach for the identification of modified proteoforms using top-down tandem mass spectra.Bioinformatics. 2017 May 1;33(9):1309-1316. doi: 10.1093/bioinformatics/btw806. Bioinformatics. 2017. PMID: 28453668 Free PMC article.
-
Spectral probabilities of top-down tandem mass spectra.BMC Genomics. 2014;15 Suppl 1(Suppl 1):S9. doi: 10.1186/1471-2164-15-S1-S9. Epub 2014 Jan 24. BMC Genomics. 2014. PMID: 24564718 Free PMC article.
-
Enhancing Top-Down Proteomics Data Analysis by Combining Deconvolution Results through a Machine Learning Strategy.J Am Soc Mass Spectrom. 2020 May 6;31(5):1104-1113. doi: 10.1021/jasms.0c00035. Epub 2020 Apr 8. J Am Soc Mass Spectrom. 2020. PMID: 32223200 Free PMC article.
-
Accurate and Efficient Resolution of Overlapping Isotopic Envelopes in Protein Tandem Mass Spectra.Sci Rep. 2015 Oct 6;5:14755. doi: 10.1038/srep14755. Sci Rep. 2015. PMID: 26439836 Free PMC article.
References
-
- Cosgrove MS, Wolberger C. How does the histone code work? Biochemistry and Cell Biology. 2005;83:468–476. - PubMed
-
- Strahl BD, Allis CD. The language of covalent histone modifications. Nature. 2000;403:41–45. - PubMed
-
- Garcia BA, Pesavento JJ, Mizzen CA, Kelleher NL. Pervasive combinatorial modification of histone H3 in human cells. Nature Methods. 2007;4:487–9. - PubMed
Publication types
MeSH terms
Substances
Grants and funding
LinkOut - more resources
Full Text Sources
Other Literature Sources
Miscellaneous
