

Formaldehyde induces micronuclei in mouse erythropoietic cells and suppresses the expansion of human erythroid progenitor cells
- PMID: 24188930
- PMCID: PMC3891867
- DOI: 10.1016/j.toxlet.2013.10.028
Formaldehyde induces micronuclei in mouse erythropoietic cells and suppresses the expansion of human erythroid progenitor cells
Abstract
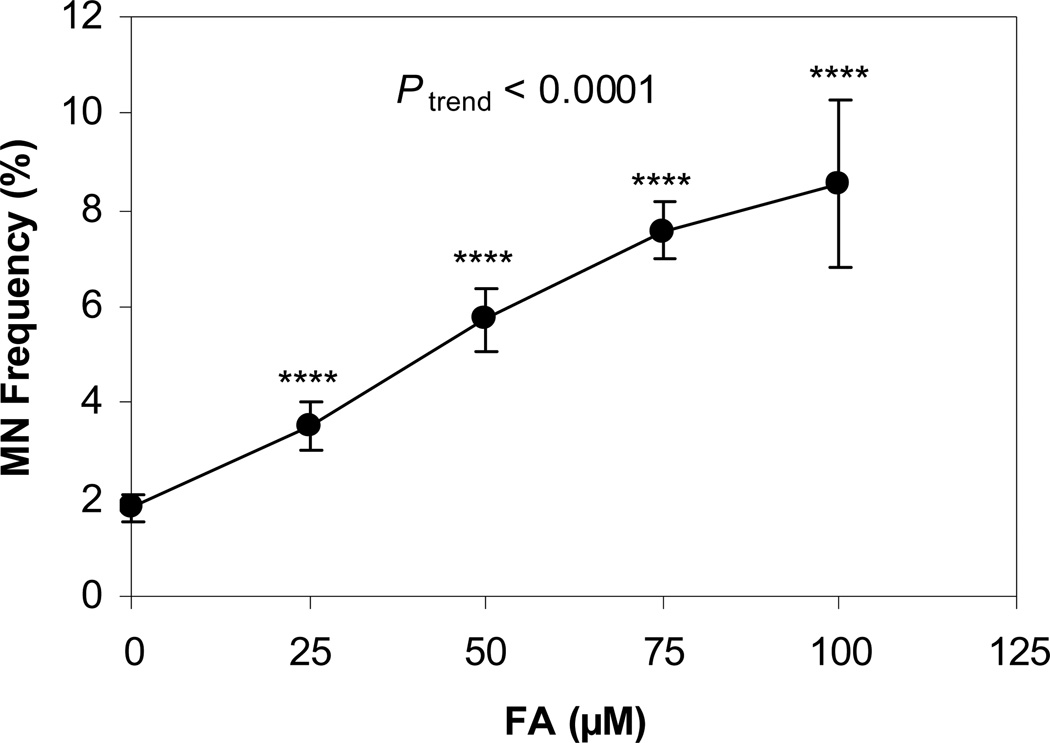
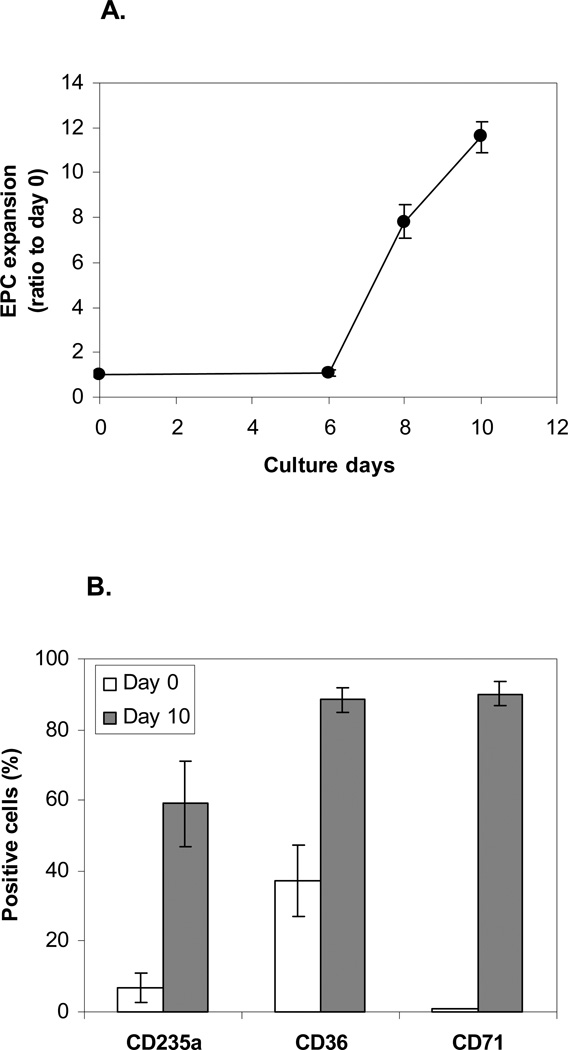
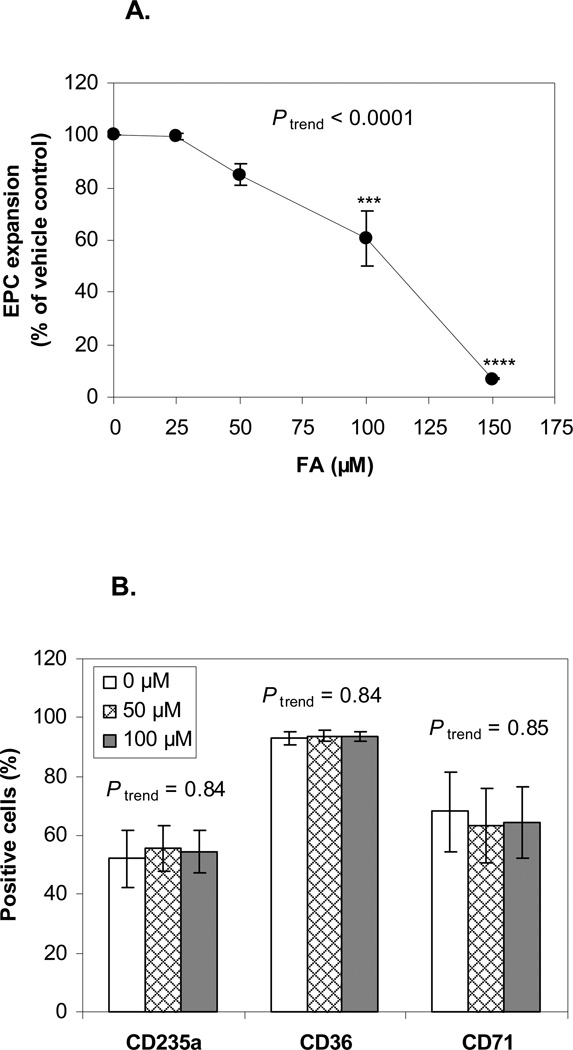
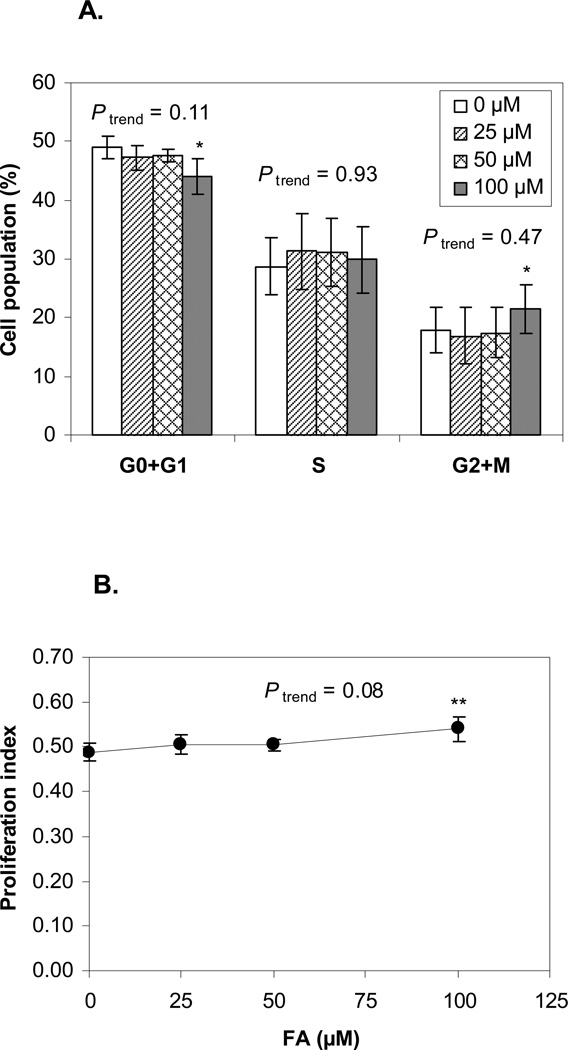
Although formaldehyde (FA) has been classified as a human leukemogen, the mechanisms of leukemogenesis remain elusive. Previously, using colony-forming assays in semi-solid media, we showed that FA exposure in vivo and in vitro was toxic to human hematopoietic stem/progenitor cells. In the present study, we have applied new liquid in vitro erythroid expansion systems to further investigate the toxic effects of FA (0-150 μM) on cultured mouse and human hematopoietic stem/progenitor cells. We determined micronucleus (MN) levels in polychromatic erythrocytes (PCEs) differentiated from mouse bone marrow. We measured cell growth, cell cycle distribution, and chromosomal instability, in erythroid progenitor cells (EPCs) expanded from human peripheral blood mononuclear cells. FA significantly induced MN in mouse PCEs and suppressed human EPC expansion in a dose-dependent manner, compared with untreated controls. In the expanded human EPCs, FA slightly increased the proportion of cells in G2/M at 100 μM and aneuploidy frequency in chromosomes 7 and 8 at 50 μM. Our findings provide further evidence of the toxicity of FA to hematopoietic stem/progenitor cells and support the biological plausibility of FA-induced leukemogenesis.
Keywords: Aneuploidy; Erythroid progenitor; Formaldehyde; Micronuclei.
Copyright © 2013 Elsevier Ireland Ltd. All rights reserved.
Figures
References
-
- Baan R, Grosse Y, Straif K, Secretan B, El Ghissassi F, Bouvard V, Benbrahim- Tallaa L, Guha N, Freeman C, Galichet L, Cogliano V. A review of human carcinogens--Part F: chemical agents and related occupations. Lancet Oncol. 2009;10:1143–1144. - PubMed
-
- Bonassi S, El-Zein R, Bolognesi C, Fenech M. Micronuclei frequency in peripheral blood lymphocytes and cancer risk: evidence from human studies. Mutagenesis. 2011;26:93–100. - PubMed
-
- Casanova M, Heck HD, Everitt JI, Harrington WW, Jr, Popp JA. Formaldehyde concentrations in the blood of rhesus monkeys after inhalation exposure. Food Chem Toxicol. 1988;26:715–716. - PubMed
-
- Chiorazzi N. Cell proliferation and death: forgotten features of chronic lymphocytic leukemia B cells. Best Pract Res Clin Haematol. 2007;20:399–413. - PubMed
Publication types
MeSH terms
Substances
Grants and funding
LinkOut - more resources
Full Text Sources
Other Literature Sources
