. 2014 Jan 3;289(1):13-27.
doi: 10.1074/jbc.M113.469239. Epub 2013 Nov 4.

Inhibition of p38 mitogen-activated protein kinase impairs influenza virus-induced primary and secondary host gene responses and protects mice from lethal H5N1 infection

Affiliations

Inhibition of p38 mitogen-activated protein kinase impairs influenza virus-induced primary and secondary host gene responses and protects mice from lethal H5N1 infection

Yvonne Börgeling et al. J Biol Chem. .

Abstract

Highly pathogenic avian influenza viruses (HPAIV) induce severe inflammation in poultry and men. One characteristic of HPAIV infections is the induction of a cytokine burst that strongly contributes to viral pathogenicity. This cell-intrinsic hypercytokinemia seems to involve hyperinduction of p38 mitogen-activated protein kinase. Here we investigate the role of p38 MAPK signaling in the antiviral response against HPAIV in mice as well as in human endothelial cells, the latter being a primary source of cytokines during systemic infections. Global gene expression profiling of HPAIV-infected endothelial cells in the presence of the p38-specific inhibitor SB 202190 revealed that inhibition of p38 MAPK leads to reduced expression of IFNβ and other cytokines after H5N1 and H7N7 infection. More than 90% of all virus-induced genes were either partially or fully dependent on p38 signaling. Moreover, promoter analysis confirmed a direct impact of p38 on the IFNβ promoter activity. Furthermore, upon treatment with IFN or conditioned media from HPAIV-infected cells, p38 controls interferon-stimulated gene expression by coregulating STAT1 by phosphorylation at serine 727. In vivo inhibition of p38 MAPK greatly diminishes virus-induced cytokine expression concomitant with reduced viral titers, thereby protecting mice from lethal infection. These observations show that p38 MAPK acts on two levels of the antiviral IFN response. Initially the kinase regulates IFN induction and, at a later stage, p38 controls IFN signaling and thereby expression of IFN-stimulated genes. Thus, inhibition of MAP kinase p38 may be an antiviral strategy that protects mice from lethal influenza by suppressing excessive cytokine expression.

Keywords: Endothelium; Highly Pathogenic Avian Influenza Virus (HPAIV); Hypercytokinemia; Influenza Virus; Interferon; JAK/STAT Signaling; STAT Transcription Factor; p38 MAPK.


Figures

FIGURE 1.
FIGURE 1.
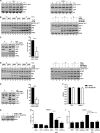
p38 is activated upon influenza A virus infection in endothelial cells. A, Western blot analysis of total lysates of HUVEC infected with 5 m.o.i. of different influenza viruses of subtypes H7N7 (FPV) or H5N1 (KAN-1). P-p38 was detected 4–8 h post-infection (h p.i.) (upper panels). Efficient infection was confirmed by immunostaining for viral PB2 protein (middle panels). Equal loading was verified by the detection of total p38 (lower panels). Blots are representative of three independent experiments. B, comparison of viral replication abilities of different influenza isolates. HUVEC were preincubated with 20 μm SB 202190 or DMSO and subsequently infected with FPV or KAN-1 with 1 m.o.i. for 9 h. Viral titers were determined by a standard plaque assay and are depicted as mean ± S.D. of three independent experiments.
FIGURE 2.
FIGURE 2.
Influence of p38 inhibition on the HPAIV-induced transcriptome. HUVEC were preincubated with 20 μm SB 202190 or DMSO. Cells were infected with 5 m.o.i. of FPV and incubated with SB 202190 for 5 h. A, principle component analysis displaying gene expression profiles of uninfected HUVEC (control) and FPV-infected HUVEC in the presence or absence of SB 202190 of three independent experiments. Vector clouds represent the up-regulated/switched on mRNAs of individual experiments and are positioned in a three-dimensional vector space according to their variance to each other. B, Venn diagram displaying the relative distribution of FPV-induced mRNAs (percent) according to the p38 MAPK dependence determined by microarray analysis of three independent experiments. Strictly p38-dependent mRNAs show expression levels below 2-fold in the presence of SB 202190. C, clustering of SB-dependent FPV-induced genes (up-regulated and switched on) according to their GO annotated function. Plotted is the statistical significance (y axis) of overrepresentation compared with the distribution of functional gene groups on the whole microarray according to Fisher's exact test. Related GO groups are displayed by identically color bars and summarized into main categories of overrepresented functional groups (restricted to two genes/GO-group + p value <0.01). D, HUVEC were incubated with different concentrations (5, 10, and 20 μm) of SB 202190 or SB 203580 in comparison to DMSO and infected with FPV (5 m.o.i.) for 5 h. Expressional changes of mRNAs of different cytokines were detected by qRT-PCR and are depicted as mean n-fold (± S.D.) of one representative experiment normalized to control mock (DMSO, 5 μm).
FIGURE 3.
FIGURE 3.
Time course of H5N1-induced genes in the presence or absence of SB 202190. A and B, effects of p38 MAPK inhibition on viral replication. HUVEC were preincubated with 20 μm SB 202190 or DMSO and subsequently infected with FPV (A) or KAN-1 (B) with 0.01 m.o.i. for the indicated time points. Viral titers were determined by a standard plaque assay and are depicted as mean ± S.D. of three independent experiments. C and D, HUVEC were preincubated with 20 μm SB 202190 or DMSO. Cells were infected with 5 m.o.i. of KAN-1 and incubated with SB 202190 for the indicated time points. Expressional changes of mRNAs of IFNβ (C) and different ISGs (D) were detected by qRT-PCR and are depicted as mean n-fold (± S.D.) of one representative experiment normalized to control.
FIGURE 4.
FIGURE 4.
p38 MAPK inhibition affects H5N1-induced IFN expression. A, impact of p38 MAPK inhibition on the IFNβ promoter activity. Vero cells were transfected with the IFNβ promoter for 24 h. Cells were preincubated with 20 μm SB 202190 or left untreated and subsequently stimulated with 500 ng of total RNA isolated from infected A549 cells (8 h, 5 m.o.i.). Total RNA from uninfected A549 cells was used as control. 5 h p.s. promoter activity was measured by a luciferase assay and the results are depicted as mean n-fold (± S.D.) of three independent experiments normalized to controls. B, Western blot analysis of total lysates of HUVEC treated with UV-inactivated, filtered conditioned media from mock-infected control cells (lanes 5 and 7) and KAN-1-infected cells (5 m.o.i., 5 h) (lanes 6 and 8). Donor cells were pretreated with DMSO (lanes 1 and 3) or SB 202190 (20 μm, lanes 2 and 4). STAT1 Tyr701 phosphorylation was detected 15 min after treatment with conditioned medium (upper panel). Equal loading was verified by the detection of total ERK2 (lower panel). Blots are representative of three independent experiments.
FIGURE 5.
FIGURE 5.
Influence of p38 MAPK inhibition on cytokine-mediated signaling. A and B, H5N1-conditioned medium experiment; donor cells for the production of conditioned medium were mock infected or infected with 5 m.o.i. of KAN-1 for 3 h. Acceptor cells were preincubated with 20 μm SB 202190 or left untreated. UV-inactivated and filtered conditioned media were transferred on acceptor cells for 2 h. Levels of IFNβ mRNA in donor (A) and acceptor cells (B) as well as ISG mRNAs were detected by qRT-PCR. The mean n-fold expression (±S.D.) of one representative experiment normalized to control is depicted. C and D, HUVEC were preincubated with 20 μm SB 202190 or DMSO. Cells were stimulated with 100 units/ml of recombinant human IFNβ (C) or IFNγ (D) and post-incubated with SB 202190 for the indicated time points. Expression of ISG mRNAs was analyzed by qRT-PCR. Mean n-fold expression (±S.D.) of one representative experiment normalized to control is depicted.
FIGURE 6.
FIGURE 6.
Influenza A virus infection induces phosphorylation of STAT1 on serine 727. A, Western blot analysis of total lysates of A549 cells infected with 5 m.o.i. of FPV or KAN-1. P-STAT1 Ser727 (upper panel) and p-p38 (middle panel) were detected 4–8 h post-infection. Equal loading was verified by the detection of total STAT1 and total p38. B and D, left: A549 (B) or Vero cells (D) were preincubated with 5 or 10 μm SB 202190 in comparison to DMSO. Cells were infected with 5 m.o.i. of FPV and incubated with the respective concentrations of SB 202190 for the indicated time points. Right, A549 (B) or Vero cells (D) were preincubated with 10 μm SB 202190 or SB 203580 in comparison to DMSO. Cells were subsequently infected with FPV (5 m.o.i.) for the indicated time points. C and E, left, A549 (C) or Vero cells (E) were transfected with p38α-specific siRNA. 48 h post-transfection cells were infected with FPV (5 m.o.i.) for 8 h. Efficient siRNA-mediated knockdown was confirmed by p38α detection. B–E, P-STAT1 Ser727 (upper panel) and viral proteins PB2 and M1 (middle panels) were detected by Western blot analysis. Equal loading was verified by the detection of total STAT1 and total ERK2. C and E, right, densitometric analysis of FPV-induced STAT1 Ser727 phosphorylation levels in the presence or absence of p38α siRNA. Phosphorylation levels were estimated as the relative intensity of the appropriate phosphorylation bands to the loading control normalized to the appropriate uninfected controls. Intensities are depicted as mean ± S.D. of three independent experiments. F, Vero cells were preincubated with 20 μm SB 202190 or DMSO and subsequently infected with FPV (1 m.o.i.) for 9 h. Viral titers are depicted as mean ± S.D. of three independent experiments. G, expression of STAT1 Y701F and double mutant (STAT1 Y701F/S727) in A549 cells was confirmed by Western blot analysis (upper panel, lanes 2 and 3). Equal loading was confirmed by the detection of total ERK2. A-E and G, blots are representative of three independent experiments. H and I, A549 cells stably expressing STAT1 Y701F, STAT1 Y701F/S727A, or the empty vector were transfected with the different ISG promoters, as indicated. Cells were stimulated with 500 units/ml of recombinant human IFNβ (H, ISRE) or IFNγ (I, GAS). 8 h post-stimulation promoter activity was measured and the results are depicted as mean n-fold (± S.D.) of three independent experiments normalized to STAT1 Y701F activity.
FIGURE 7.
FIGURE 7.
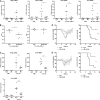
Effects of p38 inhibition on viral pathogenesis in vivo. BALB/c mice infected with 10 × LD50 of KAN-1 were treated with 20 mg/kg/day SB 202190 hydrochloride, SB 203580 hydrochloride, or solvent via intraperitoneal injection directly after infection. A, expression changes of different cytokine mRNAs in lungs were analyzed 2 days post-infection by qRT-PCR. n-Fold expression in individual animals normalized to uninfected control is depicted. B, viral lung titers 2 days post-infection of individual animals are depicted. C, BALB/c mice were treated with 20 mg/kg SB 202190 3 h prior to intranasal stimulation with 1 μg of poly(I:C) in PBS. Expression changes of different cytokine mRNAs in lungs were analyzed 6 h post-stimulation by qRT-PCR. n-Fold expression in individual animals normalized to PBS-stimulated respective controls is depicted. D and E, body weight curves; animals were excluded from the analysis when reaching less than 75% of the initial body weight. D, mean % body weight of 1–9 (initial group size) animals normalized to initial weight ± S.E. from two independent experiments is depicted. Survival curves; %-survival of 1–9 (initial group size) animals from two independent experiments is depicted. E, mean % body weight of 1–10 (initial group size) animals normalized to initial weight ± S.E. is depicted. Survival curves; %-survival of 1–10 (initial group size) is depicted.

Similar articles

Cited by

References

    1. Cillóniz C., Shinya K., Peng X., Korth M. J., Proll S. C., Aicher L. D., Carter V. S., Chang J. H., Kobasa D., Feldmann F., Strong J. E., Feldmann H., Kawaoka Y., Katze M. G. (2009) Lethal influenza virus infection in macaques is associated with early dysregulation of inflammatory related genes. PLoS Pathog. 5, e1000604. - PMC - PubMed
    1. de Jong M. D., Simmons C. P., Thanh T. T., Hien V. M., Smith G. J., Chau T. N., Hoang D. M., Chau N. V., Khanh T. H., Dong V. C., Qui P. T., Cam B. V., Ha do Q., Guan Y., Peiris J. S., Chinh N. T., Hien T. T., Farrar J. (2006) Fatal outcome of human influenza A (H5N1) is associated with high viral load and hypercytokinemia. Nat. Med. 12, 1203–1207 - PMC - PubMed
    1. Tran T. H., Nguyen T. L., Nguyen T. D., Luong T. S., Pham P. M., Nguyen vV., Pham T. S., Vo C. D., Le T. Q., Ngo T. T., Dao B. K., Le P. P., Nguyen T. T., Hoang T. L., Cao V. T., Le T. G., Nguyen D. T., Le H. N., Nguyen K. T., Le H. S., Le V. T., Christiane D., Tran T. T., Menno de J., Schultsz C., Cheng P., Lim W., Horby P., Farrar J., and World Health Organization International Avian Influenza Investigative Team (2004) Avian influenza A (H5N1) in 10 patients in Vietnam. N. Engl. J. Med. 350, 1179–1188 - PubMed
    1. Klenk H. D. (2005) Infection of the endothelium by influenza viruses. Thromb. Haemost. 94, 262–265 - PubMed
    1. Ocaña-Macchi M., Bel M., Guzylack-Piriou L., Ruggli N., Liniger M., McCullough K. C., Sakoda Y., Isoda N., Matrosovich M., Summerfield A. (2009) Hemagglutinin-dependent tropism of H5N1 avian influenza virus for human endothelial cells. J. Virol. 83, 12947–12955 - PMC - PubMed

Publication types

MeSH terms

Associated data