Review
. 2013 Nov;69(Pt 11):2167-73.
doi: 10.1107/S0907444913015291. Epub 2013 Oct 12.

Molecular replacement: tricks and treats

Affiliations
Review

Molecular replacement: tricks and treats

Chantal Abergel. Acta Crystallogr D Biol Crystallogr. 2013 Nov.

Abstract

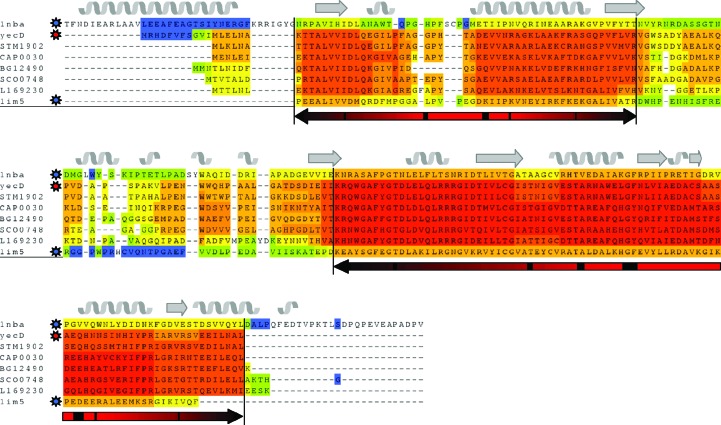
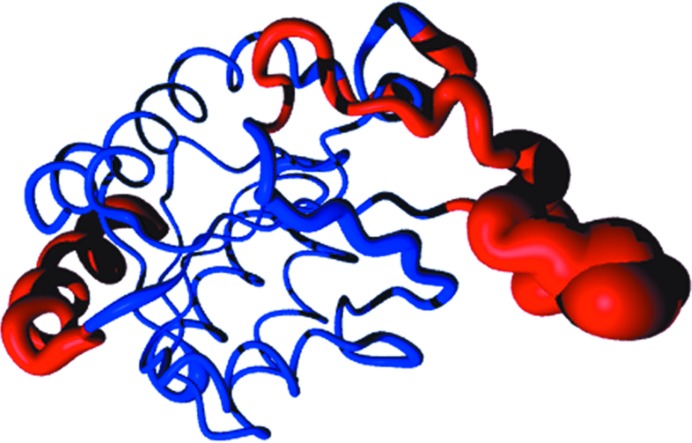
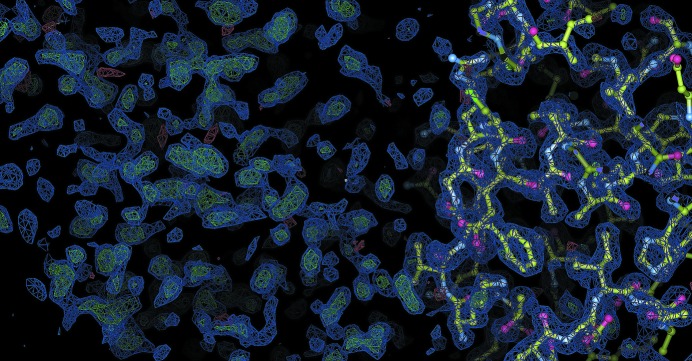
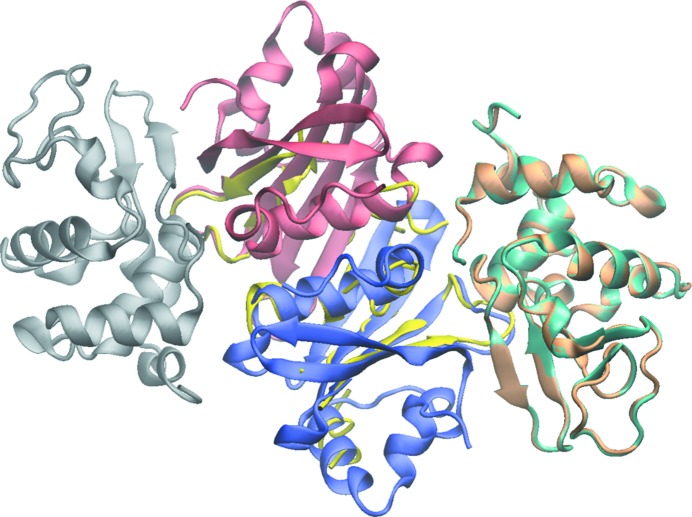
Molecular replacement is the method of choice for X-ray crystallographic structure determination provided that suitable structural homologues are available in the PDB. Presently, there are ~80,000 structures in the PDB (8074 were deposited in the year 2012 alone), of which ~70% have been solved by molecular replacement. For successful molecular replacement the model must cover at least 50% of the total structure and the Cα r.m.s.d. between the core model and the structure to be solved must be less than 2 Å. Here, an approach originally implemented in the CaspR server (http://www.igs.cnrs-mrs.fr/Caspr2/index.cgi) based on homology modelling to search for a molecular-replacement solution is discussed. How the use of as much information as possible from different sources can improve the model(s) is briefly described. The combination of structural information with distantly related sequences is crucial to optimize the multiple alignment that will define the boundaries of the core domains. PDB clusters (sequences with ≥30% identical residues) can also provide information on the eventual changes in conformation and will help to explore the relative orientations assumed by protein subdomains. Normal-mode analysis can also help in generating series of conformational models in the search for a molecular-replacement solution. Of course, finding a correct solution is only the first step and the accuracy of the identified solution is as important as the data quality to proceed through refinement. Here, some possible reasons for failure are discussed and solutions are proposed using a set of successful examples.

Keywords: molecular replacement.


Figures

Figure 1
Figure 1
3D-Coffee structural alignment of the E. coli YecD sequence. The consistency of the alignment is given by the CORE index, with a colour code from blue (inconsistent) to red (highly consistent). Secondary-structure elements have been added at the top of the alignment based on the Arthrobacter N-­carbamoylsarcosine amidohydrolase structure (PDB entry 1nba; Romao et al., 1992 ▶). The red arrows at the bottom of the alignment correspond to the core domain of the structure.
Figure 2
Figure 2
Representation of the models in ‘sausage’ mode. All model structures are superimposed and an average structure is computed. The average Cα r.m.s.d. between the mean structure and the models at a given position is illustrated by the diameter of the ribbon in the figure. Deleted regions are represented in red.
Figure 3
Figure 3
Coot image of the molecular-replacement solution (Emsley & Cowtan, 2004 ▶). The lysozyme molecule is shown in ball-and-stick representation. The 2F oF c (blue) and F oF c electron-density maps (green and red) highlight the quality of the solution around the lysozyme molecule as well as the location of the missing Ivy structure.
Figure 4
Figure 4
Cartoon representation of the Ivy–lysozyme complex. Lysozyme molecules are coloured grey (first monomer), pale brown (second monomer, initial solution) and light blue (second monomer, final solution). An intermediary stage of the Ivy dimer construction using BUSTER for refinement is coloured yellow. The monomers in the final Ivy dimer structure are coloured red and blue. The figure was produced using the VMD software (Humphrey et al., 1996 ▶).
Figure 5
Figure 5
Cartoon representation of the S. aureus RdgB protein structure. The phosphate molecule and the serine residue at the active site are shown in ball-and-stick and in stick representation, respectively. The width of the active side owing to the change in conformation is marked for each monomer.

Similar articles

Cited by

References

    1. Abergel, C. (2004). Acta Cryst. D60, 1413–1416. - PubMed
    1. Abergel, C. et al. (2003). J. Struct. Funct. Genomics, 4, 141–157. - PubMed
    1. Abergel, C., Monchois, V., Byrne, D., Chenivesse, S., Lembo, F., Lazzaroni, J.-C. & Claverie, J.-M. (2007). Proc. Natl Acad. Sci. USA, 104, 6394–6399. - PMC - PubMed
    1. Adams, P. D. et al. (2011). Methods, 55, 94–106. - PubMed
    1. Adams, P. D., Pannu, N. S., Read, R. J. & Brünger, A. T. (1997). Proc. Natl Acad. Sci. USA, 94, 5018–5023. - PMC - PubMed

Publication types

MeSH terms

Substances