. 2013 Dec;184(3):385-93.
doi: 10.1016/j.jsb.2013.10.016. Epub 2013 Nov 1.

Quantitative characterization of electron detectors for transmission electron microscopy

Affiliations

Quantitative characterization of electron detectors for transmission electron microscopy

Adrian I Ruskin et al. J Struct Biol. 2013 Dec.

Abstract

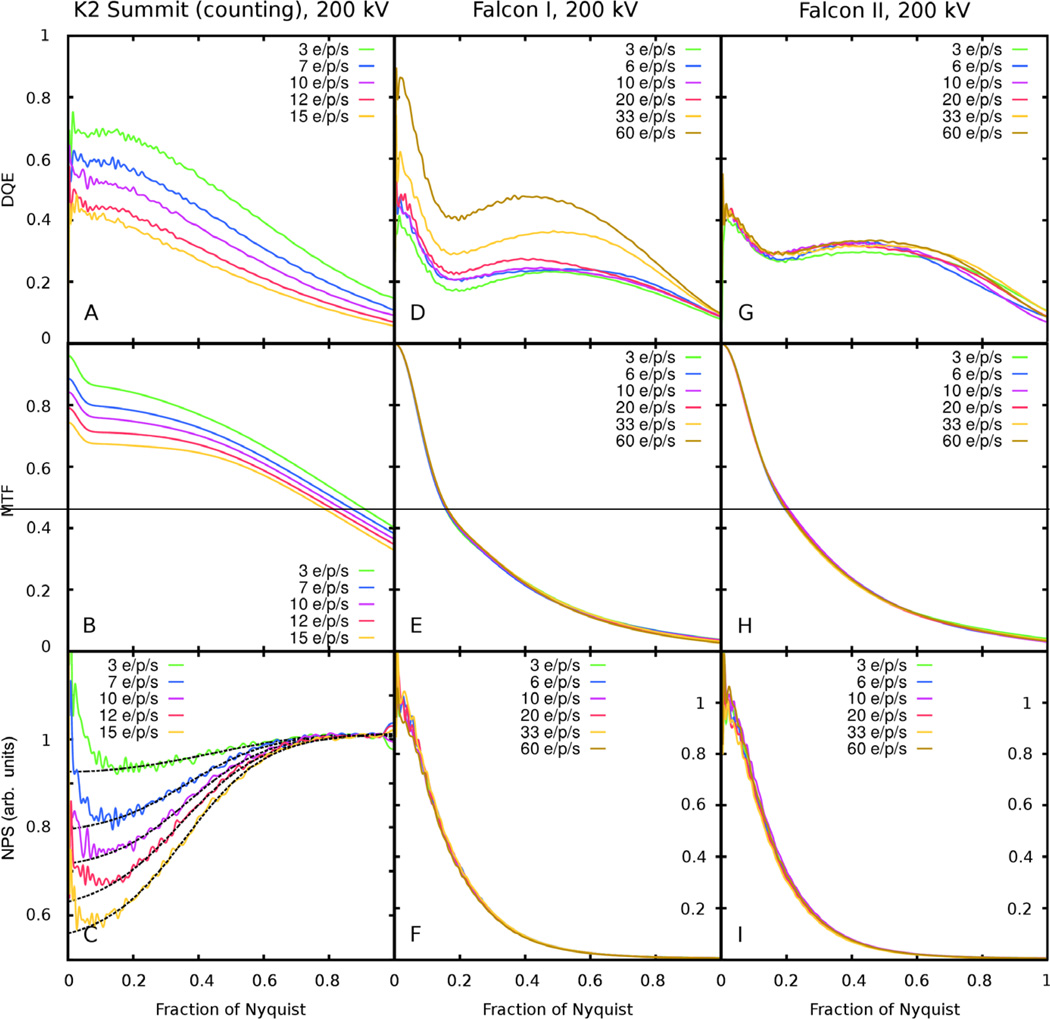
A new generation of direct electron detectors for transmission electron microscopy (TEM) promises significant improvement over previous detectors in terms of their modulation transfer function (MTF) and detective quantum efficiency (DQE). However, the performance of these new detectors needs to be carefully monitored in order to optimize imaging conditions and check for degradation over time. We have developed an easy-to-use software tool, FindDQE, to measure MTF and DQE of electron detectors using images of a microscope's built-in beam stop. Using this software, we have determined the DQE curves of four direct electron detectors currently available: the Gatan K2 Summit, the FEI Falcon I and II, and the Direct Electron DE-12, under a variety of total dose and dose rate conditions. We have additionally measured the curves for the Gatan US4000 and TVIPS TemCam-F416 scintillator-based cameras. We compare the results from our new method with published curves.

Keywords: DQE; Direct electron detector; MTF; Transmission electron microscopy.


Figures

Figure 1
Figure 1
Modeling of the noise power spectra of the K2 Summit detector operating in counting mode. A. NPS and sinc function fit (Eq. (12)) of an image recorded using the super-resolution mode of the detector. B. NPS and logistic function fit (Eq. (13)) of an image recorded using the simple counting mode.
Figure 2
Figure 2
Effect of beam stop shape on DQE. A. The DQE of the Falcon detector at 200 kV, using three different shapes of beam stop. The platinum wire images were taken at dose rates of 10 (blue line) and 3 electrons/pixel/second (purple line); the gold wire image and Brandeis pointer image used 6 electrons/pixel/second; the Janelia pointer image used 20 electrons/pixel/second, and was taken with a Falcon I detector mounted on a Titan Krios microscope located at the Janelia Farm Research Campus. B. Image of 0.5 mm diameter platinum wire inserted at beam stop position. C. Image of 0.5 mm gold wire inserted at beam stop position D. Image of the beam stop installed on a FEI TF20. The images in panels B – D were recorded using a Falcon I detector.
Figure 3
Figure 3
DQE of detectors at 200 kV. The DEDs outperform scintillator-based detectors. The dose rates used were: K2 Summit in super-resolution mode – 4 electrons/pixel/second (this value refers to physical pixels); K2 Summit in simple counting mode – 3 electrons/pixel/second; DE-12 – 13 electrons/pixel/second with a frame rate of 25 frames/second; Falcon I – 6 electrons/pixel/second; F416 – 50 electrons/pixel/second; US4000 – 40 electrons/pixel/second.
Figure 4
Figure 4
Effect of beam energy on Falcon I, F416 and K2 Summit MTF and DQE. Higher voltage leads to a faster drop in MTF at low resolution for both Falcon I and F416, due to scattering within a larger radius from the point of incidence of an electron. Smaller scattering cross-sections at higher voltage also decrease the DQE at lower resolution. MTF and DQE for the K2 Summit are essentially unchanged between 200 and 300 keV, presumably because electrons at either energy generate sufficient signal to be reliably registered by the counting algorithm implemented in the K2 Summit. The dose rates used were: Falcon I – 20 electrons/pixel/second; F416 – 50 electrons/pixel/second; K2 Summit in counting mode – 3 electrons/pixel/second.
Figure 5
Figure 5
Response of DEDs to increasing dose rate. The K2 Summit (counting mode) DQE decreases with dose rate. B. The K2 Summit MTF also decreases with dose rate and, as a consequence of lost counts at higher dose rates does not reach 1 at low frequencies (see text). C. The K2 Summit normalized NPS increases with dose rate towards higher resolution, again reflecting missed counts. The Falcon I DQE shows an apparent increase with dose rate due to a non-linear response of the detector at higher dose rates. E, F. The Falcon I MTF and the normalized NPS do not change with dose rate. G, H, I. The Falcon II DQE, MTF, and normalized NPS do not change with dose rate.
Figure 6
Figure 6
Falcon I response at high dose rates. The standard deviation of counts observed in flat field images with increasing dose rate decreases with increasing dose rate, although the total dose applied (50 electrons/pixel) remained constant. This may reflect nonlinearity in the sensor element response due to saturation. The dose rates are displayed on a log scale for ease of viewing.
Figure 7
Figure 7
Comparison of DQE curves calculated for the Falcon I camera after exposure to total lifetime doses of 5 million and 35 million electrons/pixel. The data was collected at 300 keV and with a dose rate of 20 electrons/pixel/second. The DQE curve for the lower total dose exhibits slightly increased values at high resolution. This may be due to a somewhat uneven illumination of the detector.
Figure 8
Figure 8
Spurious features in images collected using the K2 Summit detector in super-resolution mode. A. Flat field image recorded at 200 keV. B. Fourier transform of the image in A, showing a vertical line originating that indicates image artifacts. The dose rate used was 4 electrons/pixel/second (same beam and exposure time as for the pointer image used to calculate the DQE curve in Fig. 2).

References

    1. Bai X-C, Fernandez IS, McMullan G, Scheres SH. Ribosome structures to near-atomic resolution from thirty thousand cryo-EM particles. Elife. 2013;2:e00461. - PMC - PubMed
    1. Bammes BE, Rochat RH, Jakana J, Chiu W. Practical performance evaluation of a 10k×10k CCD for electron cryo-microscopy. J. Struct. Biol. 2011;175:384–393. - PMC - PubMed
    1. Brilot AF, Chen JZ, Cheng A, Pan J, Harrison SC, Potter CS, Carragher B, Henderson R, Grigorieff N. Beam-induced motion of vitrified specimen on holey carbon film. J. Struct. Biol. 2012;177:630–637. - PMC - PubMed
    1. Broek WVden, Aert SV, Dyck DV. Fully automated measurement of the modulation transfer function of charge-coupled devices above the Nyquist frequency. Microsc. Microanal. Off. J. Microsc. Soc. Am. Microbeam Anal. Soc. Microsc. Soc. Can. 2012;18:336–342. - PubMed
    1. Campbell MG, Cheng A, Brilot AF, Moeller A, Lyumkis D, Veesler D, Pan J, Harrison SC, Potter CS, Carragher B, Grigorieff N. Movies of ice-embedded particles enhance resolution in electron cryo-microscopy. Struct. Lond. Engl. 2012;20:1823–1828. 1993. - PMC - PubMed

Publication types

MeSH terms

LinkOut - more resources