. 2014;29(5):1283-94.
doi: 10.1002/jbmr.2140.

Analysis of αSMA-labeled progenitor cell commitment identifies notch signaling as an important pathway in fracture healing

Affiliations

Analysis of αSMA-labeled progenitor cell commitment identifies notch signaling as an important pathway in fracture healing

Brya G Matthews et al. J Bone Miner Res. 2014.

Abstract

Fracture healing is a regenerative process that involves coordinated responses of many cell types, but characterization of the roles of specific cell populations in this process has been limited. We have identified alpha smooth muscle actin (αSMA) as a marker of a population of mesenchymal progenitor cells in the periosteum that contributes to osteochondral elements during fracture healing. Using a lineage tracing approach, we labeled αSMA-expressing cells, and characterized changes in the periosteal population during the early stages of fracture healing by histology, flow cytometry, and gene expression profiling. In response to fracture, the αSMA-labeled population expanded and began to differentiate toward the osteogenic and chondrogenic lineages. The frequency of mesenchymal progenitor cell markers such as Sca1 and PDGFRα increased after fracture. By 6 days after fracture, genes involved in matrix production and remodeling were elevated. In contrast, genes associated with muscle contraction and Notch signaling were downregulated after fracture. We confirmed that activating Notch signaling in αSMA-labeled cells inhibited differentiation into osteogenic and adipogenic lineages in vitro and ectopic bone formation in vivo. By characterizing changes in a selected αSMA-labeled progenitor cell population during fracture callus formation, we have shown that modulation of Notch signaling may determine osteogenic potential of αSMA-expressing progenitor cells during bone healing.

Keywords: ALPHA SMOOTH MUSCLE ACTIN; FRACTURE HEALING; LINEAGE TRACING; NOTCH SIGNALING; PERIOSTEUM.


Conflict of interest statement

Disclosures

All authors state that they have no conflicts of interest.

Figures

Fig. 1
Fig. 1
Fracture histology of SMA9 mice. The distribution of SMA9+ cells in the tibia was determined histologically. (A) Histology of unfractured bone 2 days after tamoxifen induction indicates that SMA9+ cells (red) are present in the periosteal layer, particularly in the proximal end of the bone (left side). The bone structure is indicated by green autofluorescence and DIC. Higher magnification of the boxed area (B) indicates labeled elongated cells in the periosteal layer (arrowheads). DAPI-labeled nuclei are blue. (C) SMA9+ periosteal cells (arrowheads) are distinct from mature osteoblast lineage cells as indicated by separation from Col2.3GFP-labeled green cells on the bone surface in SMA9/Col2.3GFP mice. (D) Histology of a day 2 fracture indicates that SMA9+ cells are present on the periosteal surface proximal and distal to the fracture site, and expansion of these cells can be observed in areas of periosteal thickening (boxed area, E). (F) Histology of a day 6 fracture indicates marked expansion of the SMA9+ population and contribution to multiple skeletal elements within the fracture callus including osteoblasts and osteocytes (arrows, G) and chondrocytes (H). A, D, and F are composites of scanned images (scale bar = 500 μm). The scale bar on B represents 50 μm on all other images. cb = cortical bone; m = muscle.
Fig. 2
Fig. 2
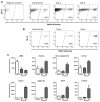
Flow cytometry analysis of periosteal cells from fractured tibias of SMA9 mice. SMA9 mice treated with tamoxifen had periosteum harvested 2 days later (unfractured control) or underwent fracture and periosteum/fracture callus tissue was harvested 2 or 6 days later. Cells were stained for surface markers, and flow cytometry analysis performed. (A) The frequency of SMA9+ cells within the nonhematopoietic component was determined by gating CD45-−and mature hematopoietic lineage marker negative cells (upper panel), then determining the percentage of SMA9+ tdTomato expressing cells (lower panel). (B) Analysis of SMA9+ and SMA9-−periosteal cells for CD45 and hematopoietic lineage markers. (C) Expression of mesenchymal stem/ progenitor and endothelial markers in SMA9+ CD45Lincells. Data from a representative experiment are presented.
Fig. 3
Fig. 3
Cell sorting and gene expression analysis of SMA9+ periosteal cells from fractures. (A) Sorting of SMA9+ cells from total unstained periosteal cell preparations was performed based on the gates indicated. (B) Reanalysis of sorted cells indicated significant enrichment of SMA9+ cells at all time points. A representative experiment is shown. (C) Expression of selected skeletal lineage marker genes in sorted SMA9+ cells as determined by microarray. Data are pooled from 3 replicates, and where genes were represented by multiple probes, representative data are shown. *p < 0.05 compared with unfractured control.
Fig. 4
Fig. 4
Expression of Notch pathway components in SMA9+ periosteal cells after fracture. Expression of Notch pathway genes was determined using real-time PCR. The average expression of unfractured control samples was normalized to 1. Data are pooled from 2 to 3 replicates. *p < 0.05 compared with control determined by one-way ANOVA with Dunnett’s post test.
Fig. 5
Fig. 5
Notch signaling activity and differentiation potential in periosteal cultures from SMA9/NICD mice. SMA9+ periosteal cells from SMA9/NICD mice (Activated Notch) and SMA9 littermates (Control) were replated for differentiation assays. Notch pathway activation was evaluated by expression of target gene Hey1 (A). Cre-induced loxP recombination was confirmed by PCR (B), with the intact construct indicated by a 492-bp band, as in untreated animals (lane 1), whereas recombination (296-bp band) is evident in treated unsorted (lane 2) and SMA9+ (lane 3) cultures. Under osteogenic differentiation conditions, tdTomato+ control cultures underwent differentiation as indicated by induction of bone sialoprotein and osteocalcin expression, whereas activated Notch cultures showed minimal increases in expression (C). Adipogenesis was evaluated by morphology (D, upper panel, tdTomato fluorescence overlaid by phase contrast) and oil red O staining (D, lower panel). This was confirmed by expression of adipocyte markers adiponectin and adipsin (E). Data are from an experiment representative of 2 to 3 biological replicates. Real-time PCR data are normalized to expression in the control confluent (Conf.) culture. *p <0.05 compared with equivalent control sample determined by Student’s t test. Scale bar = 50 μm. Conf. = confluent culture; OB = osteogenic culture; AD = adipogenic culture.
Fig. 6
Fig. 6
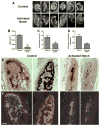
Effect of SMA9-driven Notch signaling on ectopic bone formation. Unsorted SMA9 (Control) and SMA9/NICD (Activated Notch) BMSC cultures were embedded in collagen gels and implanted subcutaneously in NSG mice. Implants were harvested 3 weeks later. (A) X-rays indicate qualitative structural differences in the ossicles formed from the different cultures. (B) Bone mineral density (BMD) was determined by DXA. (C) Mineralized area was determined using sections stained with von Kossa. Representative sections from each group are shown (E). (D, F) tdTomato+ cells embedded in mineralized tissue, identified by DIC imaging, were counted (see green arrowheads) and the number per mm2 of mineralized tissue were calculated. n = 6 implants/group. Image analysis was performed on 3 to 6 sections per implant. *p < 0.05 determined by Student’s t test.

Comment in

References

    1. Schindeler A, McDonald MM, Bokko P, Little DG. Bone remodeling during fracture repair: the cellular picture. Semin Cell Dev Biol. 2008;19:459–66. - PubMed
    1. Ushiku C, Adams DJ, Jiang X, Wang L, Rowe DW. Long bone fracture repair in mice harboring GFP reporters for cells within the osteoblastic lineage. J Orthop Res. 2010;28:1338–47. - PubMed
    1. Olmedo ML, Landry PS, Sadasivan KK, et al. Regulation of osteoblast levels during bone healing. J Orthop Trauma. 1999;13:356–62. - PubMed
    1. Thompson Z, Miclau T, Hu D, Helms JA. A model for intramembranous ossification during fracture healing. J Orthop Res. 2002;20:1091–8. - PubMed
    1. Claes L, Recknagel S, Ignatius A. Fracture healing under healthy and inflammatory conditions. Nat Rev Rheumatol. 2012;8:133–43. - PubMed

Publication types