. 2013 Nov 18;210(12):2721-37.
doi: 10.1084/jem.20131324. Epub 2013 Nov 4.

Annular PIP3 accumulation controls actin architecture and modulates cytotoxicity at the immunological synapse

Affiliations

Annular PIP3 accumulation controls actin architecture and modulates cytotoxicity at the immunological synapse

Audrey Le Floc'h et al. J Exp Med. .

Erratum in

Abstract

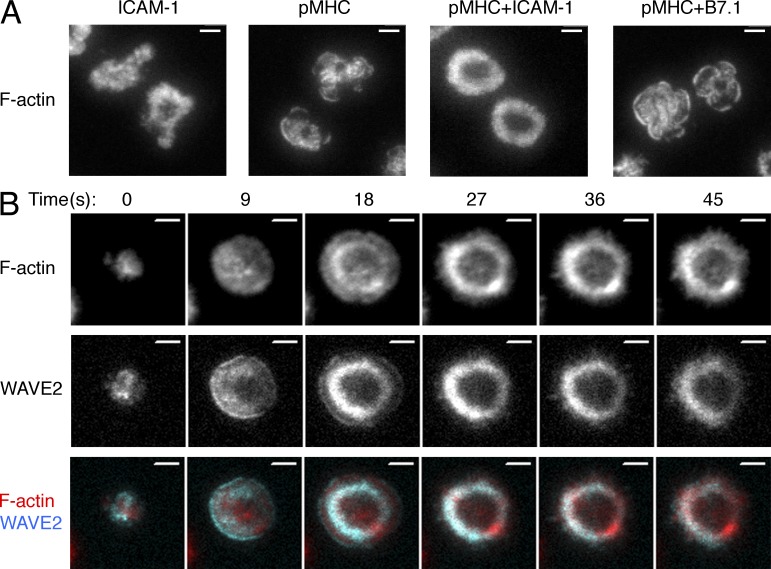
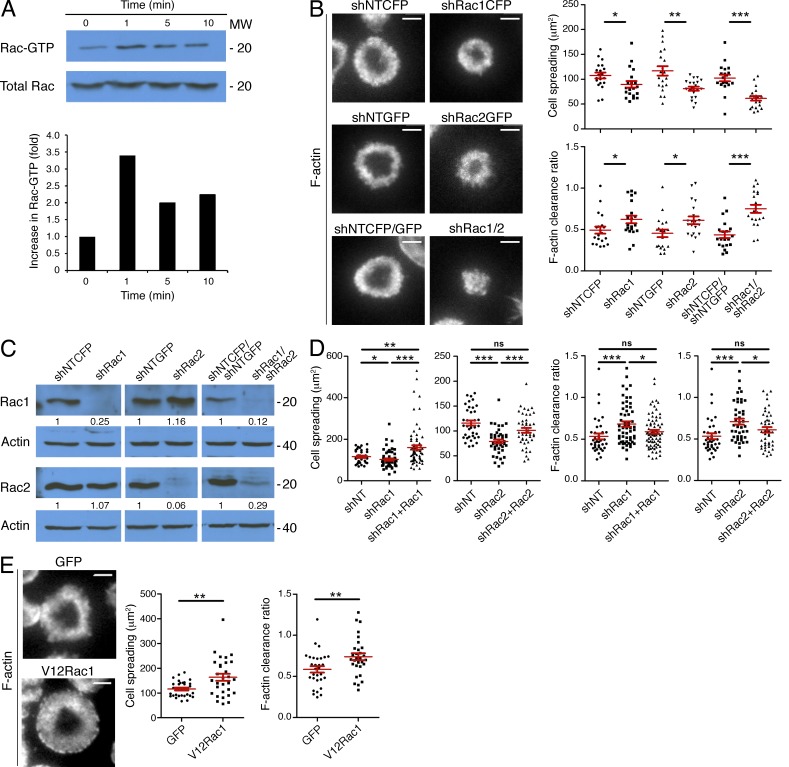
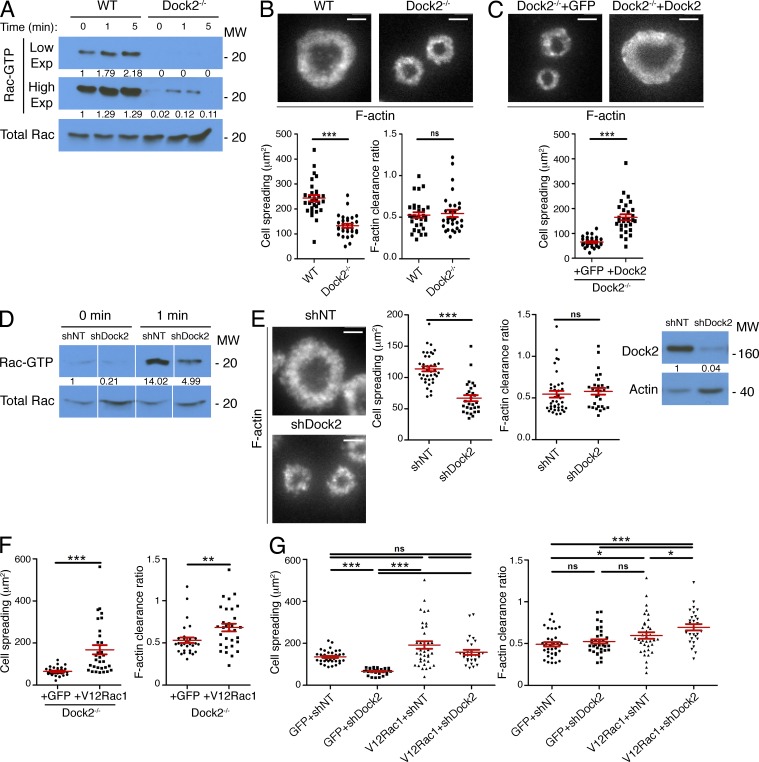
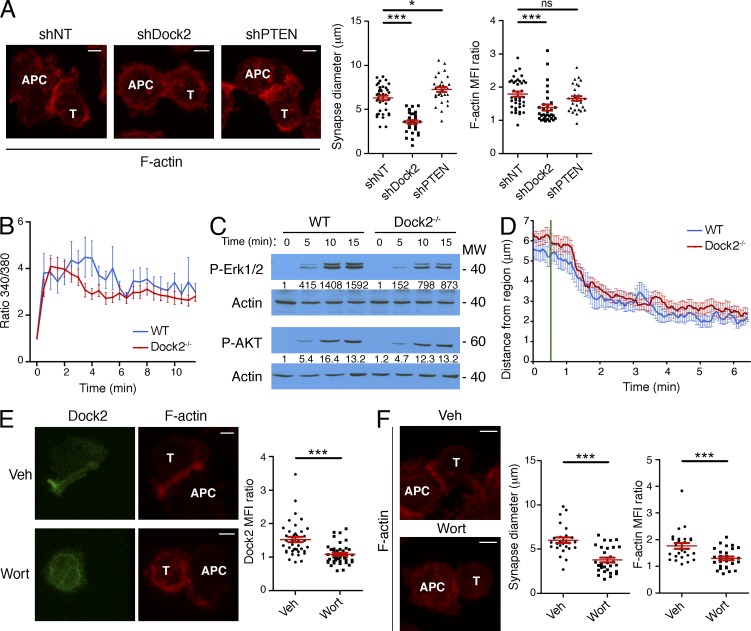
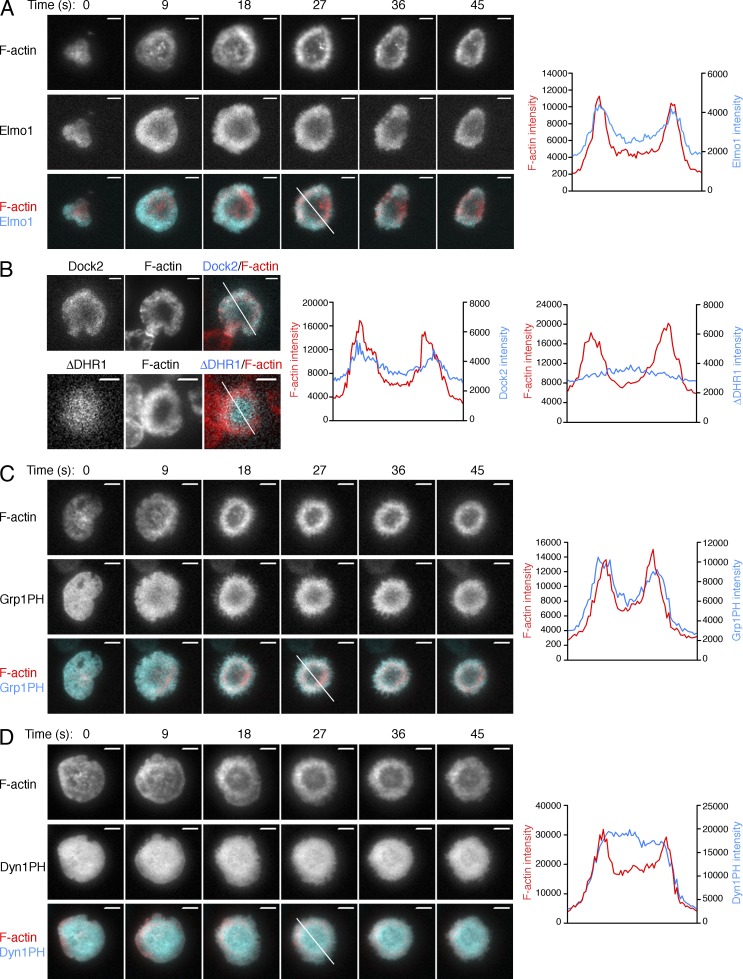
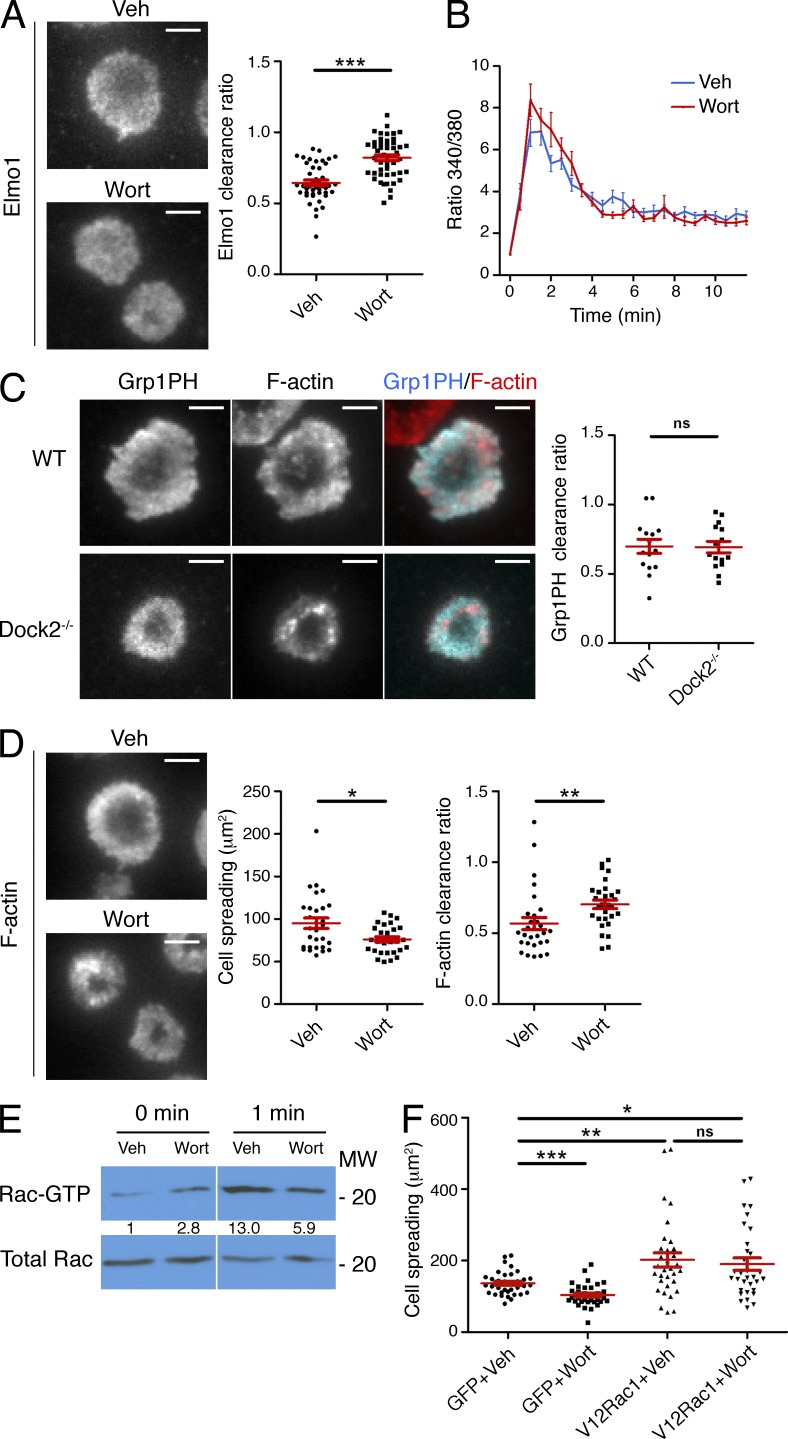
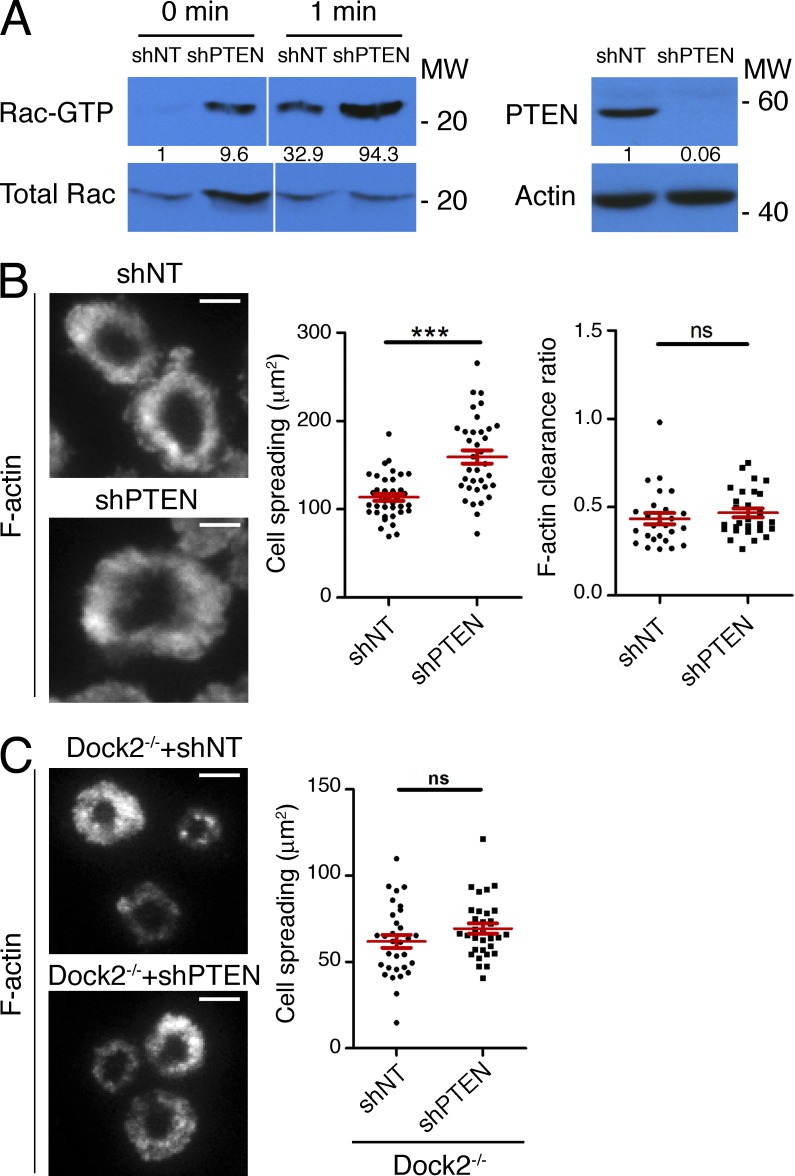
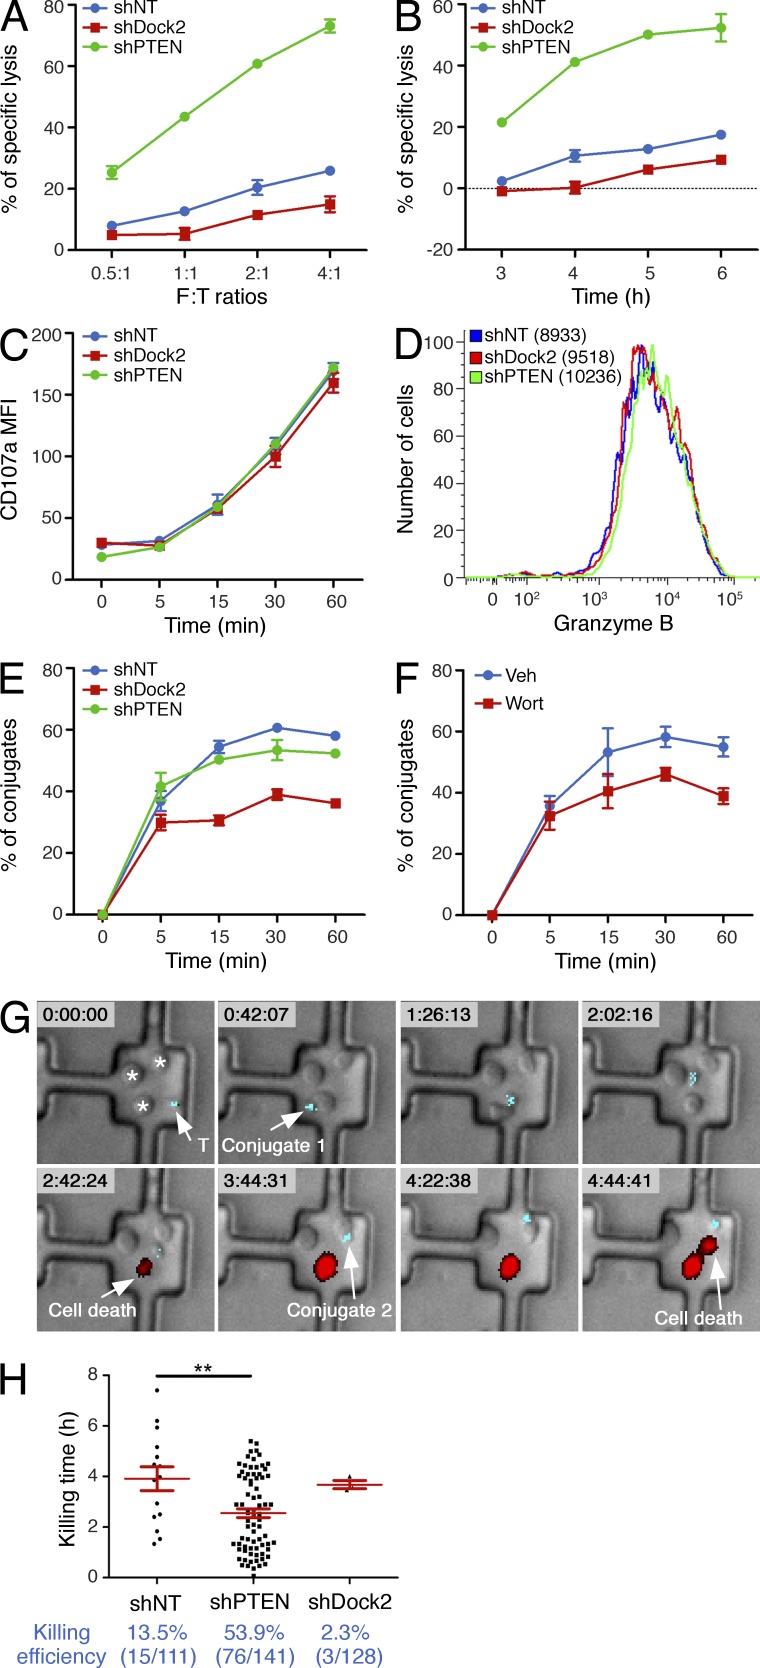
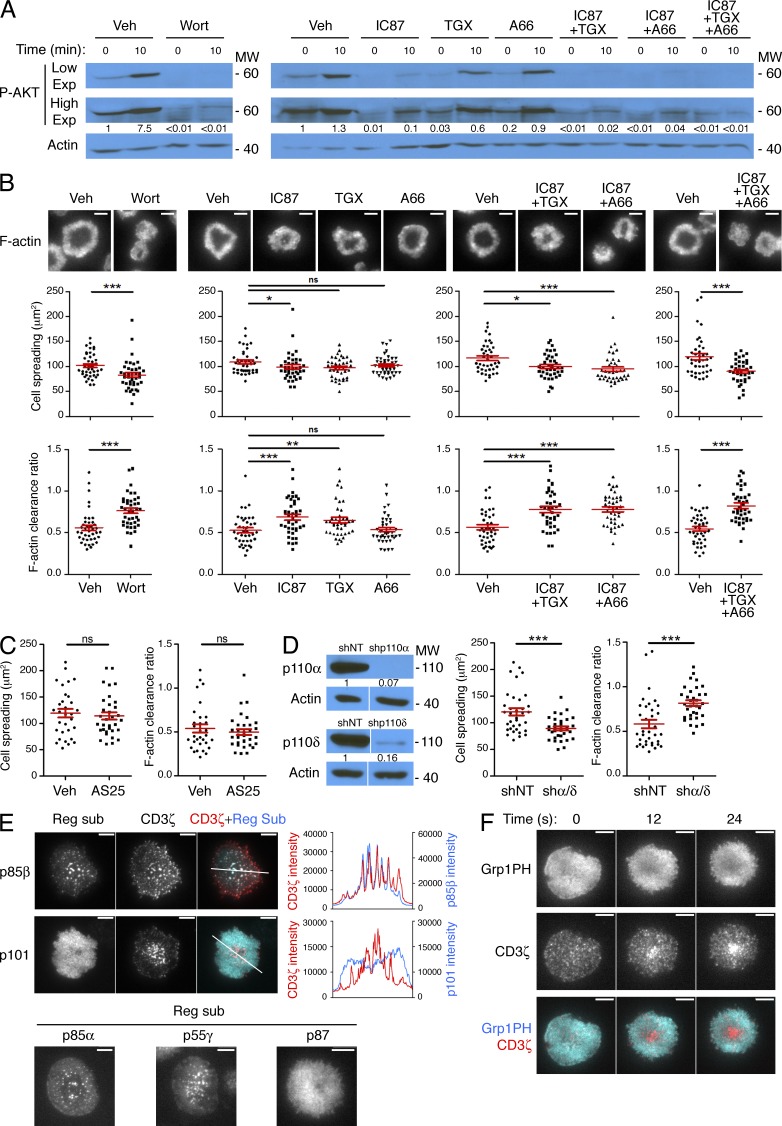
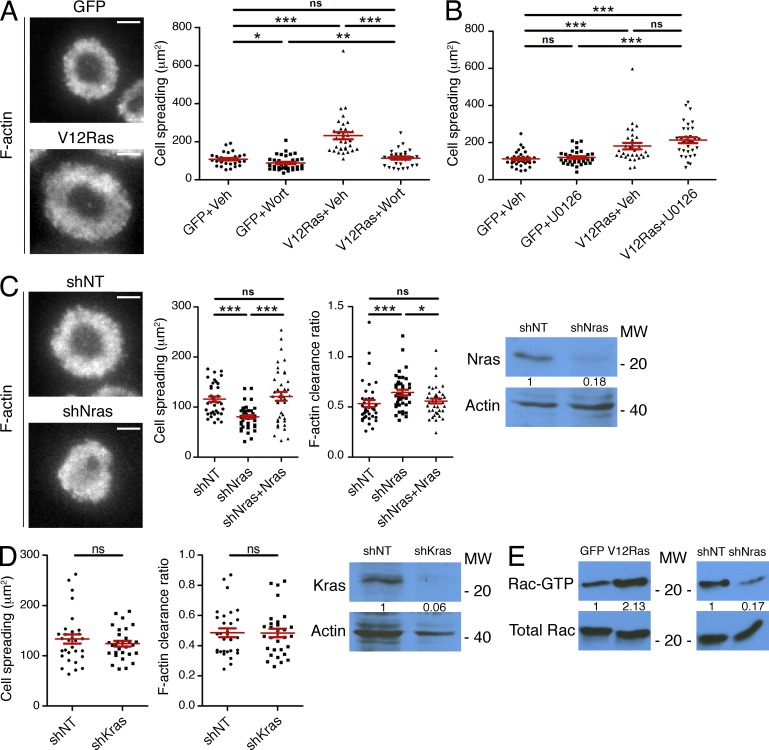
The immunological synapse formed by a T lymphocyte on the surface of a target cell contains a peripheral ring of filamentous actin (F-actin) that promotes adhesion and facilitates the directional secretion of cytokines and cytolytic factors. We show that growth and maintenance of this F-actin ring is dictated by the annular accumulation of phosphatidylinositol trisphosphate (PIP3) in the synaptic membrane. PIP3 functions in this context by recruiting the exchange factor Dock2 to the periphery of the synapse, where it drives actin polymerization through the Rho-family GTPase Rac. We also show that synaptic PIP3 is generated by class IA phosphoinositide 3-kinases that associate with T cell receptor microclusters and are activated by the GTPase Ras. Perturbations that inhibit or promote PIP3-dependent F-actin remodeling dramatically affect T cell cytotoxicity, demonstrating the functional importance of this pathway. These results reveal how T cells use lipid-based signaling to control synaptic architecture and modulate effector responses.


Figures

Figure 1.
Figure 1.
T cells form stable F-actin rings on bilayers containing pMHC and ICAM-1. (A) OT-1 CTLs were stimulated for 10 min on bilayers containing the indicated ligands, fixed, and stained with fluorescently labeled phalloidin. Representative TIRF images are shown. Images are representative of at least 100 cells imaged over at least two independent experiments. (B) OT-1 CTLs expressing RFP-labeled Lifeact together with GFP-labeled WAVE2 were analyzed by TIRF microscopy on bilayers containing pMHC and ICAM-1. A representative time-lapse montage (9-s intervals) is shown. Images are representative of at least 150 cells imaged over four independent experiments. Bars, 5 µm.
Figure 2.
Figure 2.
Rac1 and Rac2 are essential for synaptic F-actin remodeling. (A) OT-1 CTLs were stimulated for the indicated times with beads coated with pMHC and ICAM-1. Top, active Rac was isolated using GST-PAK1-PBD and visualized by immunoblot. Bottom, quantification of activated Rac from the blot shown above, corrected using total Rac expression and normalized to the first time point. (B) OT-1 CTLs were transduced with nontargeting control shRNA (shNT) or shRNA specific for Rac1 and/or Rac2. Cells were then stimulated on lipid bilayers containing pMHC and ICAM-1, fixed, and stained with fluorescently labeled phalloidin. Representative TIRF images are shown (left). Cell spreading (top graph) and F-actin clearance ratio (bottom graph) were quantified for each condition (n = 20 cells). (C) shRNA-transduced OT-1 CTLs were probed for Rac1 and Rac2 by immunoblot. Numbers denote corrected, normalized amounts of Rac1 and Rac2 in each lane (see Materials and methods). (D) OT-1 CTLs were transduced with the indicated shRNAs together with shRNA-resistant, GFP-labeled Rac1 or Rac2 as shown. Transduced cells were stimulated as described in B, and F-actin was visualized by phalloidin staining. Quantification of cell spreading and F-actin clearance ratio is shown (n ≥ 37 cells). (E) OT-1 CTLs expressing GFP-labeled V12Rac1 or GFP alone were stimulated as described in B, and F-actin was analyzed by phalloidin staining. Representative TIRF images are shown (left). Right, quantification of cell spreading and F-actin clearance ratio (n = 30 cells). Bars, 5 µm. In scatter plots, red lines and error bars denote the mean and SEM, respectively. P-values were calculated using the Mann-Whitney test (two-tailed). ***, P < 0.001, **, P < 0.01, *, P ≤ 0.05, and ns, P > 0.05. All data are representative of at least two independent experiments.
Figure 3.
Figure 3.
Dock2 drives F-actin dynamics at the IS through Rac. (A) 2B4 T cell blasts from Dock2+/+ (WT) and Dock2−/− mice were stimulated for the indicated times with beads coated with pMHC and ICAM-1. Cell extracts were incubated with GST-PAK1-PBD, and activation of Rac analyzed by immunoblot. Numbers denote corrected, normalized amounts of activated Rac in each lane, quantified from high and low film exposures, as indicated. (B) WT and Dock2−/− 2B4 T cells were stimulated on bilayers containing pMHC and ICAM-1, fixed, and stained with fluorescently labeled phalloidin. Representative TIRF images are shown (top). Bottom, quantification of cell spreading and F-actin clearance ratio (n = 30 cells). (C) Dock2−/− 2B4 T cells expressing GFP-labeled Dock2 or GFP alone were stained with phalloidin after spreading on stimulatory bilayers. Representative TIRF images are shown (top). Bottom, quantification of cell spreading (n ≥ 30 cells). (D and E) OT-1 CTLs were transduced with nontargeting control shRNA (shNT) or shRNA specific for Dock2. (D) Transduced cells were stimulated with beads coated with pMHC and ICAM-1, and Rac activation was analyzed by pulldown assay using GST-PAK1-PBD. Numbers denote corrected, normalized amounts of activated Rac. (E) Transduced cells were stimulated on lipid bilayers containing pMHC and ICAM-1, fixed, and stained with fluorescently labeled phalloidin. Representative TIRF images are shown (left). Middle, quantification of cell spreading and F-actin clearance ratio (n ≥ 30 cells). Right, transduced cells were probed for Dock2 by immunoblot. Numbers denote corrected, normalized amounts of Dock2. (F and G) Dock2-deficient 2B4 T cells (F) and shDock2-expressing OT-1 CTLs (G) were transduced with GFP-labeled V12Rac1 or GFP alone, stimulated as described in B, and imaged after phalloidin staining. Quantification of cell spreading and F-actin clearance ratio are shown (n > 30 cells for Dock2−/− experiment; n ≥ 28 cells for shDock2 experiment). Bars, 5 µm. In scatter plots, red lines and error bars denote the mean and SEM, respectively. P-values were calculated using the Mann-Whitney test. ***, P < 0.001, **, P < 0.01, *, P ≤ 0.05, and ns, P > 0.05. All data are representative of at least two independent experiments.
Figure 4.
Figure 4.
PIP3-Dock2 signaling is required for F-actin accumulation in CTL–target cell conjugates. (A) OT-1 CTLs expressing nontargeting (NT) control shRNA or shRNA against Dock2 or PTEN were mixed with OVA-pulsed RMA-s cells and the conjugates imaged by confocal microscopy after fixation and staining with fluorescently labeled phalloidin. Representative images are shown on the left. Right, quantification of IS size and synaptic F-actin enrichment (see Materials and methods). (B) Fura-2AM–loaded WT and Dock2−/− 2B4 T cells were imaged on lipid bilayers containing pMHC and ICAM-1. Mean, background-corrected Fura-2AM ratios are plotted versus time for each condition (n = 12 cells). (C) Immunoblot analysis of phospho-Erk1/2 (P-Erk1/2) and phospho-AKT (P-AKT) in WT and Dock2−/− 2B4 T cells stimulated on lipid bilayers for the indicated times. Numbers denote corrected, normalized amounts of P-Erk1/2 and P-AKT. (D) WT and Dock2−/− 2B4 T cells expressing GFP-labeled tubulin were attached to glass surfaces containing immobilized, photoactivatable pMHC. Localized UV irradiation was then used to activate TCRs in a small region of membrane, and the position of the MTOC monitored by epifluorescence microscopy. The mean distance between the MTOC and the irradiated region is plotted against time (n > 20 cells), with UV irradiation indicated by the green line. Error bars denote SEM. (E) Left, representative images of phalloidin-stained conjugates formed by OVA-pulsed RMA-s cells and OT-1 CTLs expressing GFP-labeled Dock2 either in the presence of wortmannin or vehicle control (Veh). Right, quantification of synaptic Dock2 enrichment. (F) Left, representative images of phalloidin-stained conjugates formed by OVA-pulsed RMA-s cells and OT-1 CTLs in the presence of wortmannin (Wort) or vehicle control (Veh). Right, quantification of IS size and synaptic F-actin enrichment. In all images, T cells and APCs are indicated with white text. Bars, 3 µm. In scatter plots, red lines and error bars denote the mean and SEM, respectively. P-values were calculated using the Mann-Whitney test. ***, P < 0.001, *, P ≤ 0.05, and ns, P > 0.05. Data in A, E, and F were pooled from two independent experiments. Data in B–D are representative of at least two independent experiments.
Figure 5.
Figure 5.
Dock2/Elmo and PIP3 localization at the IS. (A) OT-1 CTLs expressing RFP-labeled Lifeact together with GFP-labeled Elmo1 were analyzed by TIRF microscopy on lipid bilayers containing pMHC and ICAM-1. Left, representative time-lapse montages (9-s intervals). Right, linescans (derived from the white line in the left panel, time = 27 s) showing F-actin and Elmo1 accumulation. (B) OT-1 CTLs expressing GFP-fusions of either Dock2 or a Dock2 mutant lacking the DHR-1 domain (ΔDHR1) were imaged on stimulatory bilayers after fixation and staining with phalloidin. Left, representative TIRF images are shown. Right, linescans (derived from the white lines in the images to the left) showing F-actin and Dock2 accumulation at the IS. (C and D) OT-1 CTLs expressing RFP-labeled Lifeact together with GFP-labeled Grp1PH (C) or DynPH (D) were analyzed by TIRF microscopy on lipid bilayers containing pMHC and ICAM-1. Left, representative time-lapse montages (9-s intervals). Right, linescans (derived from the white line in the left panel, time = 27 s) showing F-actin and Grp1PH/Dyn1PH accumulation. Bars, 5 µm. Images in A, C, and D are representative of at least 80 cells imaged over at least four independent experiments. Images in B are representative of at least 12 cells imaged over two independent experiments.
Figure 6.
Figure 6.
PIP3 controls Rac-dependent F-actin dynamics through Dock2/Elmo. (A) OT-1 CTLs expressing GFP-labeled Elmo1 were pretreated with wortmannin (Wort) or vehicle control (Veh) and imaged on stimulatory lipid bilayers after fixation. Left, representative TIRF images are shown. Right, quantification of Elmo1 clearance ratio (n > 40 cells). (B) Fura-2AM–loaded OT-1 CTLs pretreated with wortmannin or vehicle were imaged on lipid bilayers containing pMHC and ICAM-1. Mean, background-corrected Fura-2AM ratios are plotted versus time for each condition (n = 20 cells). Error bars denote SEM. (C) WT and Dock2−/− 2B4 T cells expressing GFP-labeled Grp1PH were imaged on lipid bilayers containing pMHC and ICAM-1 after phalloidin staining. Left, representative TIRF images are shown. Right, quantification of Grp1PH clearance ratio (n = 15 cells). (D) OT-1 CTLs were treated with wortmannin as indicated, stimulated on bilayers containing pMHC and ICAM-1, and stained with fluorescently labeled phalloidin. Left, representative TIRF images are shown. Right, quantification of cell spreading and F-actin clearance ratio (n ≥ 30 cells). (E) OT-1 CTLs pretreated with wortmannin as indicated were stimulated with beads coated with pMHC and ICAM-1. Cell extracts were incubated with GST-PAK1-PBD and activation of Rac was determined by immunoblot. Numbers denote corrected, normalized amounts of activated Rac. (F) CTLs expressing GFP-labeled V12Rac1 or GFP alone were treated with wortmannin as indicated and then stimulated and imaged as described in D. Quantification of cell spreading is shown (n ≥ 30 cells). Bars, 5 µm. In scatter plots, red lines and error bars denote the mean and SEM, respectively. P-values were calculated using the Mann-Whitney test. ***, P < 0.001, **, P < 0.01, *, P ≤ 0.05, and ns, P > 0.05. All data are representative of at least two independent experiments.
Figure 7.
Figure 7.
PTEN regulates Rac activation and IS growth. (A) Left, OT-1 CTLs expressing shRNA specific for PTEN or a control shRNA (shNT) were stimulated with beads coated with pMHC and ICAM-1. Cell extracts were incubated with GST-PAK1-PBD, and activation of Rac was determined by immunoblot. Numbers denote corrected, normalized amounts of activated Rac. Right, CTL lysates were probed for PTEN by immunoblot. Numbers denote corrected, normalized amounts of PTEN. (B) OT-1 CTLs expressing shRNA against PTEN or nontargeting control shRNA were imaged on stimulatory bilayers after phalloidin staining. Left, representative TIRF images are shown. Right, quantification of cell spreading and F-actin clearance ratio (n = 35 cells). (C) Dock2−/− 2B4 T cells expressing the indicated shRNAs were imaged on stimulatory bilayers as described in B. Left, representative TIRF images are shown. Right, quantification of cell spreading (n > 30 cells). Bars, 5 µm. In scatter plots, red lines and error bars denote the mean and SEM, respectively. P-values were calculated using the Mann-Whitney test. ***, P < 0.001 and ns, P > 0.05. Data are representative of at least two independent experiments.
Figure 8.
Figure 8.
PI3K-Dock2 signaling modulates the efficiency of target cell killing. (A–C) RMA-s target cells loaded with 100 nM OVA peptide were mixed with OT-1 CTLs expressing either nontargeting shRNA or shRNA specific for Dock2 or PTEN. (A and B) Specific lysis of target cells at the indicated effector to target (E:T) ratios after 6 h (A), or at the indicated times at an E:T ratio of 2:1 (B). Killing assays were performed in triplicate. (C) Cell surface exposure of CD107a was determined by flow cytometry. (D) OT-1 CTLs expressing the indicated shRNA constructs were stained using antibodies against granzyme B and analyzed by flow cytometry. (E and F) RMA-s target cells loaded with 100 nM OVA peptide were mixed with shRNA-expressing (E) or wortmannin-treated (F) OT-1 CTLs as indicated. CTL–target cell conjugate formation was assessed by gating on the GFP+ (CTLs), PKH26+ (RMA-s targets) population (see Materials and methods). Degranulation and conjugate assays were performed in duplicate at an E:T ratio of 1:1. Error bars indicate SEM. (G and H) OT-1 CTLs and RMA-s targets were imaged in PDMS wells in the presence of PI to detect killing events. (G) Time-lapse montage showing the killing of two RMA-s cells by a CTL expressing shRNA against PTEN. Time is shown (hours:minutes:seconds) at the top of each image. White arrows indicate conjugate formation and killing events. (H) Top, quantification of killing time, with red lines and bars indicating mean and SEM, respectively. Bottom, killing efficiency of monogamous CTL–target cell contacts is shown in blue. In scatter plots, red lines and error bars denote the mean and SEM, respectively. P-values were calculated using the Mann-Whitney test. **, P < 0.01. Data in A–F are representative of at least two independent experiments. Data in G and H were pooled from two independent experiments.
Figure 9.
Figure 9.
PIP3-dependent synaptic remodeling is largely mediated by PI3Kδ. (A and B) OT-1 CTLs were pretreated with isoform-specific class IA PI3K inhibitors (alone or in combination) or vehicle controls (Veh) and then stimulated for the indicated times on lipid bilayers containing pMHC and ICAM-1. (A) P-AKT levels were assessed by immunoblot. High and low film exposures are shown. Numbers denote corrected, normalized amounts of P-AKT. (B) Cell spreading and F-actin clearance ratio were assessed after phalloidin-staining (n = 40 cells). Representative TIRF images are shown above, with quantification below. (C) OT-1 CTLs were pretreated with AS252424 (AS25) or vehicle control (Veh) and then stimulated and imaged as described in B. Quantification of cell spreading and F-actin clearance ratio are shown (n > 30 cells). (D) OT-1 CTLs expressing shRNA against p110α together with p110δ or nontargeting control shRNA (shNT) were stimulated and imaged as described in B. Left, transduced cells were probed for p110α and p110δ by immunoblot. Numbers denote corrected, normalized amounts of p110α and p110δ. Right, quantification of cell spreading and F-actin clearance ratio (n ≥ 33 cells). (E) Top, OT-1 CTLs expressing RFP-tagged CD3ζ together with the indicated GFP-labeled PI3K regulatory subunits were fixed on stimulatory bilayers. Top left, representative TIRF images are shown. Top right, linescans (derived from the white lines shown on the TIRF images) showing colocalization between CD3ζ and the PI3K regulatory subunits. Bottom, representative TIRF images of OT-1 CTLs expressing the indicated GFP-labeled PI3K regulatory subunits after fixation on stimulatory bilayers. (F) OT-1 CTLs expressing RFP-labeled CD3ζ together with GFP-labeled Grp1PH were imaged by TIRF microscopy on bilayers containing pMHC and ICAM-1. A representative time-lapse montage is shown (12-s intervals). Bars, 5 µm. In scatter plots, red lines and error bars denote the mean and SEM, respectively. P-values were calculated using the Mann-Whitney test. ***, P < 0.001, **, P < 0.01, *, P ≤ 0.05, and ns, P > 0.05. Data in A–D are representative of at least two independent experiments. Images in E and F are representative of at least 17 cells imaged over at least two independent experiments.
Figure 10.
Figure 10.
Ras drives PI3K activation and F-actin remodeling at the IS. (A and B) OT-1 CTLs expressing GFP-labeled V12Ras or GFP alone were stimulated on lipid bilayers containing pMHC and ICAM-1 in the presence of either wortmannin (Wort; A) or U0126 (B) as indicated (Veh = vehicle control). Cells were then fixed and phalloidin-stained. Quantification of cell spreading is shown (n ≥ 30 cells). Representative TIRF images of V12Ras-expressing cells and GFP-expressing controls are shown to the left in A. (C) OT-1 CTLs were transduced with nontargeting control shRNA (shNT) or shRNA specific for Nras either in the presence or the absence of shRNA-resistant, GFP-labeled Nras. Cells were then stimulated on bilayers containing pMHC and ICAM-1, fixed, and stained with phalloidin. Left, representative TIRF images are shown. Middle, quantification of cell spreading and F-actin clearance ratio (n ≥ 37 cells). Right, Nras protein expression by immunoblot. Numbers denote corrected, normalized amounts of Nras. (D) OT-1 CTLs expressing nontargeting control shRNA (shNT) or shRNA specific for Kras were stimulated on bilayers containing pMHC and ICAM-1, fixed, and stained with phalloidin. Left, quantification of cell spreading and F-actin clearance ratio (n = 30 cells). Right, Kras protein expression by immunoblot. Numbers denote corrected, normalized amounts of Kras. (E) OT-1 CTLs expressing V12ras (left) or shNras (right) were stimulated, along with the indicated controls, using beads coated with pMHC and ICAM-1. Cell extracts were incubated with GST-PAK1-PBD, and Rac activation was analyzed by immunoblot. Numbers denote corrected, normalized amounts of activated Rac. Bars, 5 µm. In scatter plots, red lines and error bars denote the mean and SEM, respectively. P-values were calculated using the Mann-Whitney test (two-tailed). ***, P < 0.001, **, P < 0.01, *, P ≤ 0.05, and ns, P > 0.05. Data are representative of at least two independent experiments.

References

    1. Abeyweera T.P., Merino E., Huse M. 2011. Inhibitory signaling blocks activating receptor clustering and induces cytoskeletal retraction in natural killer cells. J. Cell Biol. 192:675–690. 10.1083/jcb.201009135 - DOI - PMC - PubMed
    1. Acuto O., Michel F. 2003. CD28-mediated co-stimulation: a quantitative support for TCR signalling. Nat. Rev. Immunol. 3:939–951. 10.1038/nri1248 - DOI - PubMed
    1. Alcázar I., Marqués M., Kumar A., Hirsch E., Wymann M., Carrera A.C., Barber D.F. 2007. Phosphoinositide 3-kinase γ participates in T cell receptor-induced T cell activation. J. Exp. Med. 204:2977–2987. 10.1084/jem.20070366 - DOI - PMC - PubMed
    1. Anikeeva N., Somersalo K., Sims T.N., Thomas V.K., Dustin M.L., Sykulev Y. 2005. Distinct role of lymphocyte function-associated antigen-1 in mediating effective cytolytic activity by cytotoxic T lymphocytes. Proc. Natl. Acad. Sci. USA. 102:6437–6442. 10.1073/pnas.0502467102 - DOI - PMC - PubMed
    1. Babich A., Li S., O’Connor R.S., Milone M.C., Freedman B.D., Burkhardt J.K. 2012. F-actin polymerization and retrograde flow drive sustained PLCγ1 signaling during T cell activation. J. Cell Biol. 197:775–787. 10.1083/jcb.201201018 - DOI - PMC - PubMed

Publication types

MeSH terms

Substances