. 2013 Nov 19;110(47):E4427-36.
doi: 10.1073/pnas.1315104110. Epub 2013 Nov 4.

Regulatory R region of the CFTR chloride channel is a dynamic integrator of phospho-dependent intra- and intermolecular interactions

Affiliations

Regulatory R region of the CFTR chloride channel is a dynamic integrator of phospho-dependent intra- and intermolecular interactions

Zoltan Bozoky et al. Proc Natl Acad Sci U S A. .

Abstract

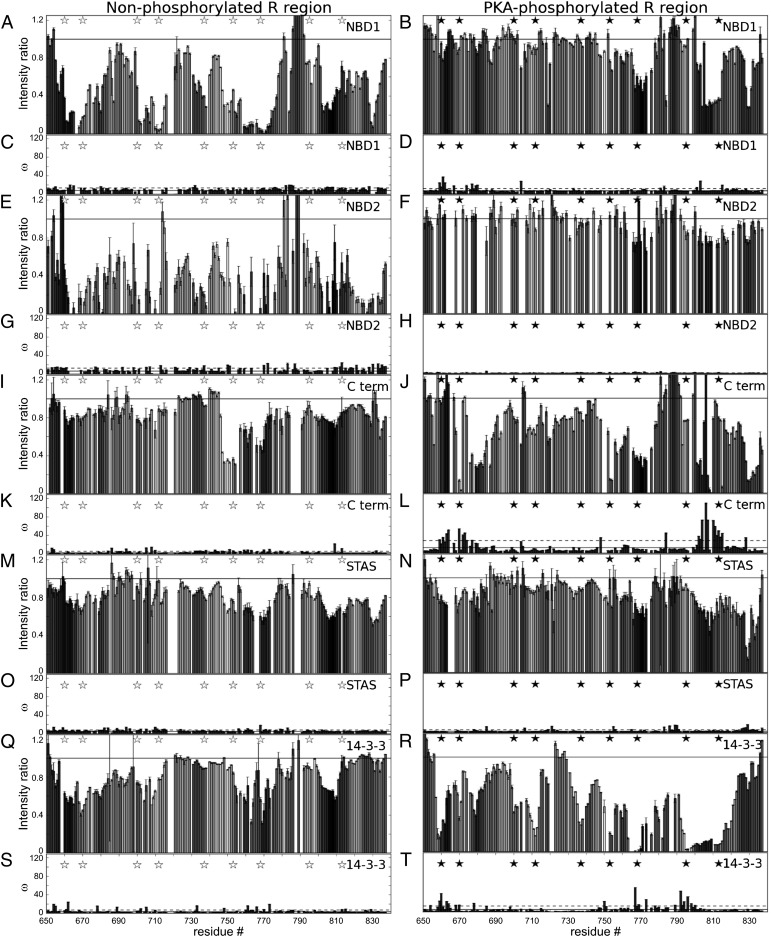
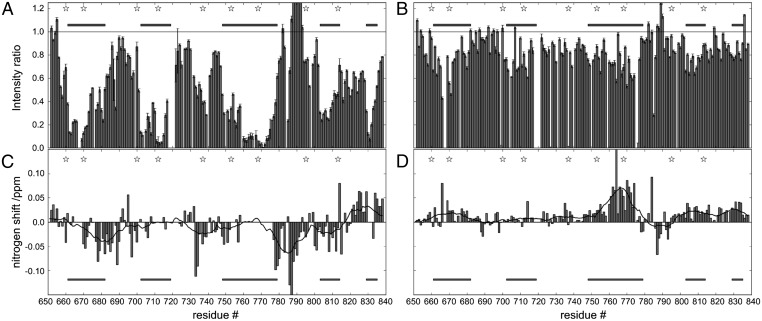
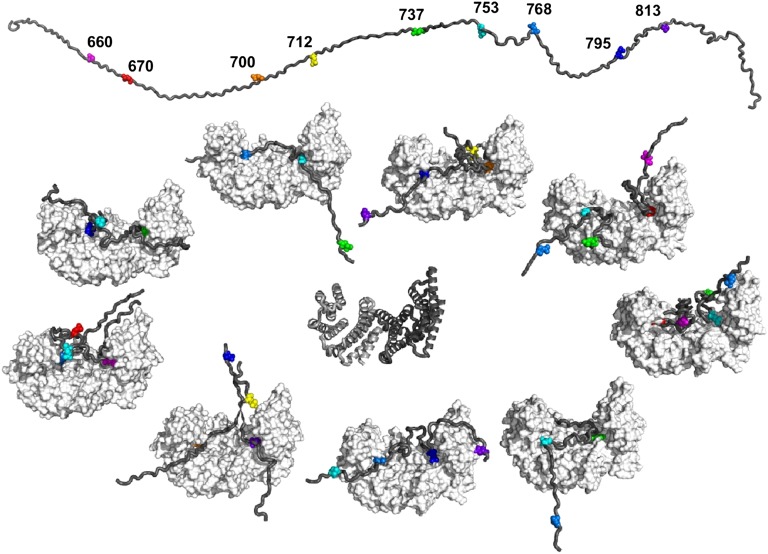
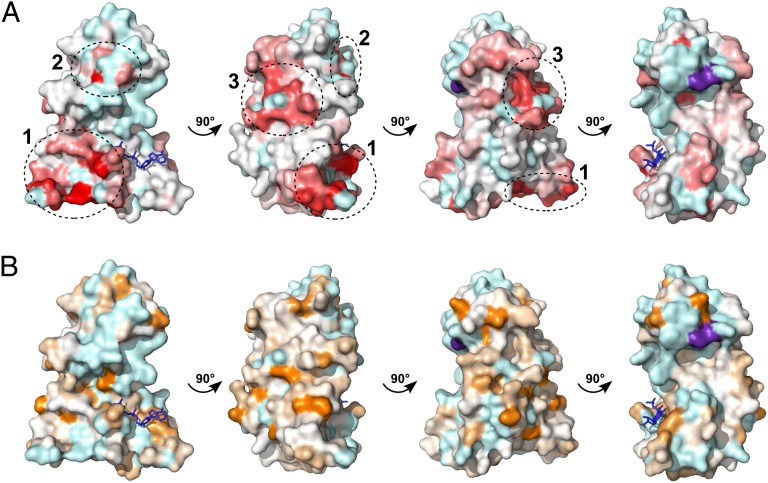
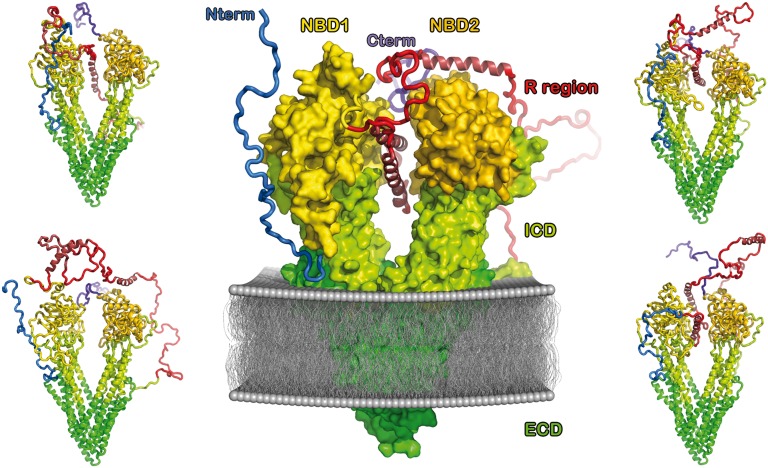
Intrinsically disordered proteins play crucial roles in regulatory processes and often function as protein interaction hubs. Here, we present a detailed characterization of a full-length disordered hub protein region involved in multiple dynamic complexes. We performed NMR, CD, and fluorescence binding studies on the nonphosphorylated and highly PKA-phosphorylated human cystic fibrosis transmembrane conductance regulator (CFTR) regulatory region, a ∼200-residue disordered segment involved in phosphorylation-dependent regulation of channel trafficking and gating. Our data provide evidence for dynamic, phosphorylation-dependent, multisite interactions of various segments of the regulatory region for its intra- and intermolecular partners, including the CFTR nucleotide binding domains 1 and 2, a 42-residue peptide from the C terminus of CFTR, the SLC26A3 sulphate transporter and antisigma factor antagonist (STAS) domain, and 14-3-3β. Because of its large number of binding partners, multivalent binding of individually weak sites facilitates rapid exchange between free and bound states to allow the regulatory region to engage with different partners and generate a graded or rheostat-like response to phosphorylation. Our results enrich the understanding of how disordered binding segments interact with multiple targets. We present structural models consistent with our data that illustrate this dynamic aspect of phospho-regulation of CFTR by the disordered regulatory region.

Keywords: fuzzy complex; protein interaction network.


Conflict of interest statement

The authors declare no conflict of interest.

Figures

Fig. 1.
Fig. 1.
R region binding profiles and chemical shift perturbations on binding. Intensity ratios and combined 1H, 13C, and 15N chemical shift changes in Hertz of nonphosphorylated and PKA-phosphorylated 15N,13C-labeled R region in the presence and absence of various unlabeled binding partners. (A–D) CFTR NBD1, (E–H) CFTR NBD2, (I–L) CFTR C terminus, (M–P) SLC26A3 STAS domain, and (Q–T) 14-3-3β. On binding profile plots, solid lines represent the value one (the baseline expectation for no binding with no intensity change). Bars are colored according to the second structure propensities (Fig. S2 A and B) from most helical (black; 39% helical for nonphosphorylated and 30% helical for phosphorylated R region) to most extended structure (white; 29% extended for nonphosphorylated and 35% extended for phosphorylated R region). Maximal values of the sharpened residues around 790 reach (A) 2.5 on plot and (J) 1.8 on plot. On chemical shift perturbation plots, the solid line represents the average value, and the dashed line corresponds to a value plus 1 SD from the average. Not all residues were included in our analysis; missing are prolines, residues lacking assignments, and residues not resolved in the NMR spectra. PKA phosphorylation sites are marked as stars (open for the nonphosphorylated state and gray for the phosphorylated state).
Fig. 2.
Fig. 2.
NBD1 binding to protonated and deuterated nonphosphorylated R region. (A and B) R region binding profiles and (C and D) nitrogen chemical shift perturbations on binding NBD1 to (A and C) protonated or (B and D) deuterated R region. (C and D) For chemical shift perturbations, positive values correspond to increases in fractional sampling of helical conformations, whereas negative values represent enhanced extended conformations. The solid lines in C and D correspond to the trend lines using Savitzky–Golay filtering with a cubic polynomial and window size of 25. Horizontal bars indicate the R region interaction segments to NBD1 determined using a protonated R region sample (Fig. 1A). PKA phosphorylation sites are marked as stars.
Fig. 3.
Fig. 3.
Ensemble model for R region interaction with 14-3-3β. The structure of the 14-3-3β homodimer, rendered in ribbon and surface representation (gray), in a complex with PKA-phosphorylated R region (black), showing randomly selected conformers. PKA phosphorylation sites are colored in rainbow colors.
Fig. 4.
Fig. 4.
Nonphosphorylated R region binding to NBD1. (A) Resonance intensity reductions and (B) chemical shift changes for 15N-labeled NBD1 on binding to unlabeled R region plotted as a color gradient (PDB ID code 2PZE) (43) from intense color to white (from largest effect to no effect, respectively). Pale cyan indicates residues with no assignments or for which resonances were not resolved on the spectrum. The position of F508 is marked as purple, whereas ATP is indicated in blue. The orientation of the first surface model is from the NBD2 perspective (i.e., looking head on to the heterodimer interface). The three zones displaying significant broadening are highlighted (dashed circles).
Fig. 5.
Fig. 5.
Structural models of full-length CFTR in the nonphosphorylated R region state representing a closed channel state and showing five selected conformers. The N terminus is in blue (aa 1–47), TMDs and the extracellular domain (ECD) are dark green (aa 48–148, 195–241, 308–350, 860–932, 991–1034, and 1103–1149), ICDs are light green (aa 149–194, 242–307, 351–383, 842–859, 933–990, 1035–1102, and 1150–1192), NBD1 is yellow (aa 384–643), NBD2 is gold (aa 1193–1443), C terminus is purple (aa 1444–1480), and R region is red (aa 644–841).

References

    1. Ward JJ, Sodhi JS, McGuffin LJ, Buxton BF, Jones DT. Prediction and functional analysis of native disorder in proteins from the three kingdoms of life. J Mol Biol. 2004;337(3):635–645. - PubMed
    1. Tompa P. Intrinsically disordered proteins: A 10-year recap. Trends Biochem Sci. 2012;37(12):509–516. - PubMed
    1. Dosztányi Z, Chen J, Dunker AK, Simon I, Tompa P. Disorder and sequence repeats in hub proteins and their implications for network evolution. J Proteome Res. 2006;5(11):2985–2995. - PubMed
    1. Dunker AK, Cortese MS, Romero P, Iakoucheva LM, Uversky VN. Flexible nets. The roles of intrinsic disorder in protein interaction networks. FEBS J. 2005;272(20):5129–5148. - PubMed
    1. Haynes C, et al. Intrinsic disorder is a common feature of hub proteins from four eukaryotic interactomes. PLoS Comput Biol. 2006;2(8):e100. - PMC - PubMed

Publication types

MeSH terms

Substances

LinkOut - more resources