. 2013 Nov 5:14:758.
doi: 10.1186/1471-2164-14-758.

Metabolite and transcriptome analysis during fasting suggest a role for the p53-Ddit4 axis in major metabolic tissues

Affiliations

Metabolite and transcriptome analysis during fasting suggest a role for the p53-Ddit4 axis in major metabolic tissues

Michael Schupp et al. BMC Genomics. .

Abstract

Background: Fasting induces specific molecular and metabolic adaptions in most organisms. In biomedical research fasting is used in metabolic studies to synchronize nutritional states of study subjects. Because there is a lack of standardization for this procedure, we need a deeper understanding of the dynamics and the molecular mechanisms in fasting.

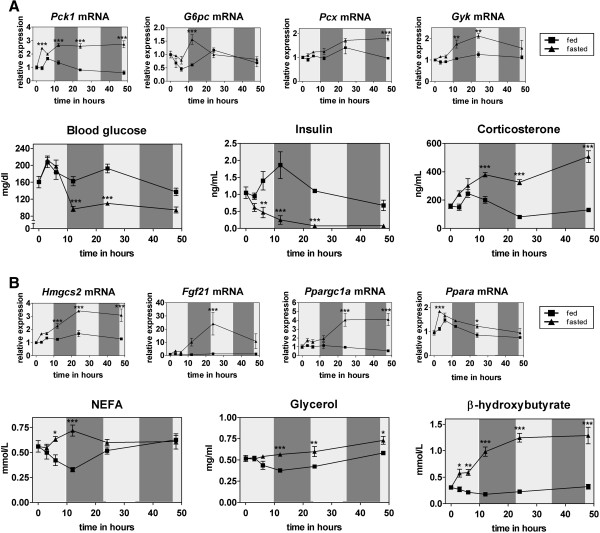
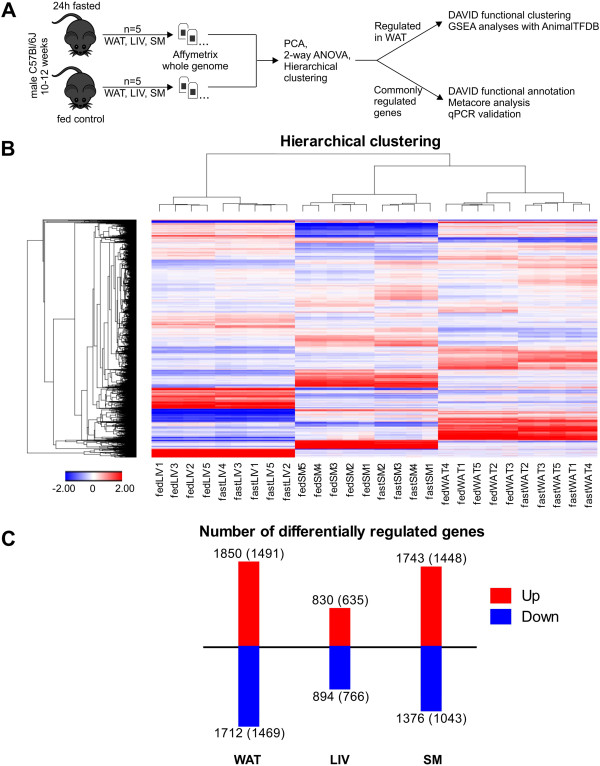
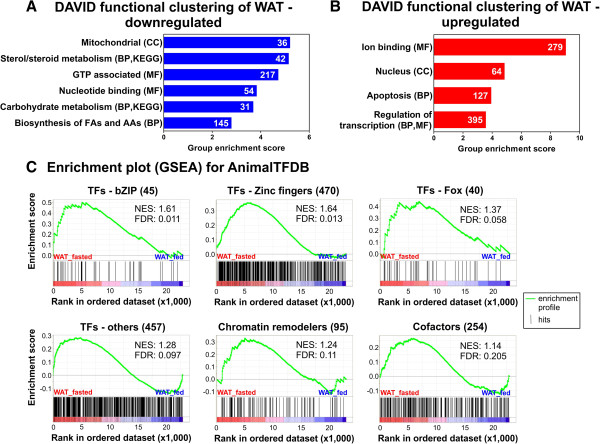
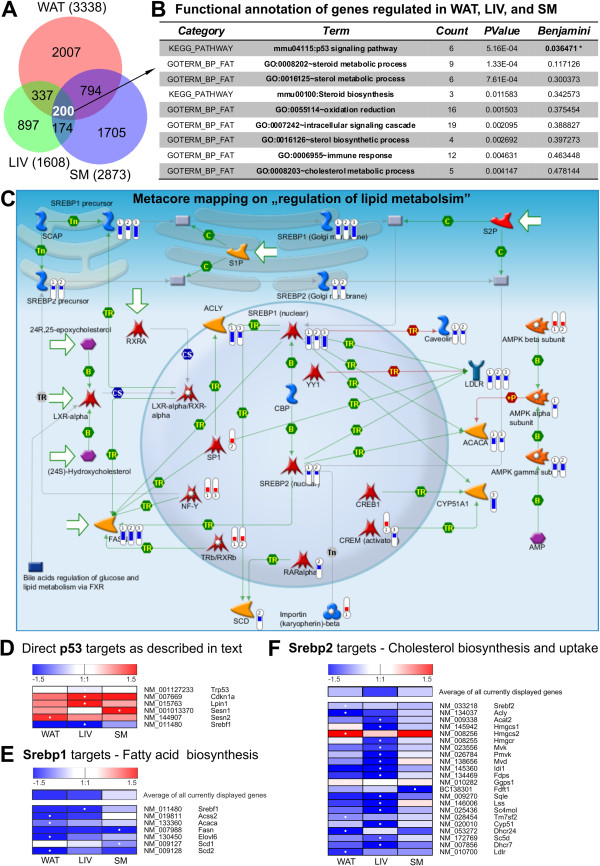
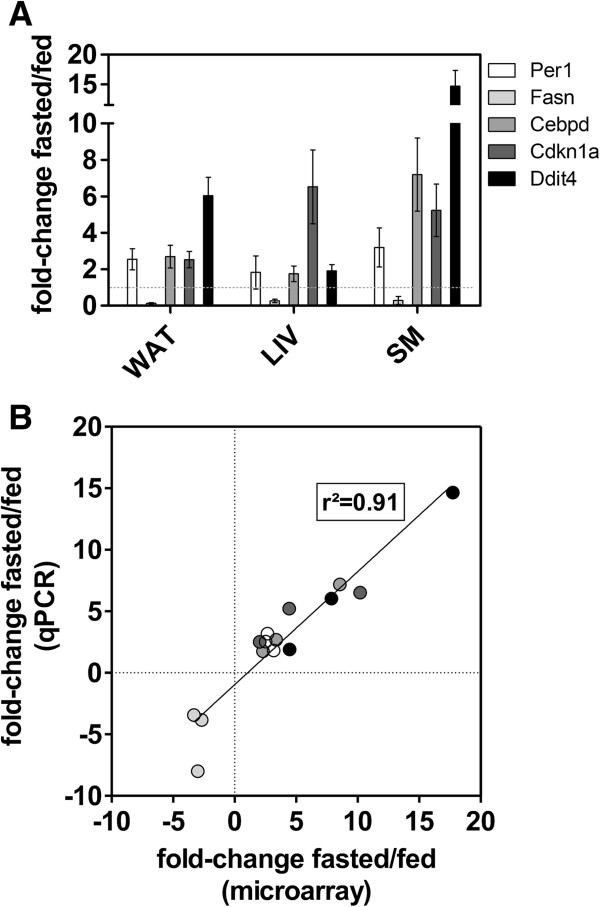
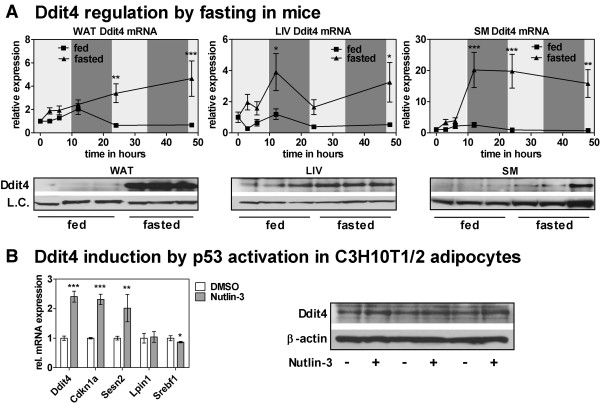
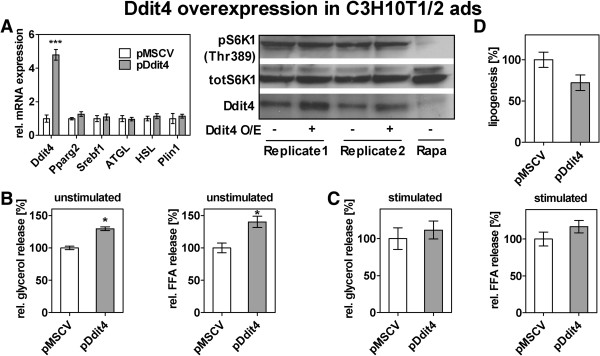
Results: We investigated the dynamic changes of liver gene expression and serum parameters of mice at several time points during a 48 hour fasting experiment and then focused on the global gene expression changes in epididymal white adipose tissue (WAT) as well as on pathways common to WAT, liver, and skeletal muscle. This approach produced several intriguing insights: (i) rather than a sequential activation of biochemical pathways in fasted liver, as current knowledge dictates, our data indicates a concerted parallel response; (ii) this first characterization of the transcriptome signature of WAT of fasted mice reveals a remarkable activation of components of the transcription apparatus; (iii) most importantly, our bioinformatic analyses indicate p53 as central node in the regulation of fasting in major metabolic tissues; and (iv) forced expression of Ddit4, a fasting-regulated p53 target gene, is sufficient to augment lipolysis in cultured adipocytes.

Conclusions: In summary, this combination of focused and global profiling approaches provides a comprehensive molecular characterization of the processes operating during fasting in mice and suggests a role for p53, and its downstream target Ddit4, as novel components in the transcriptional response to food deprivation.


Figures

Figure 1
Figure 1
Kinetics of selected metabolites/hormones and expression of liver genes during a 48 hour fasting period. (A) and (B) Serum parameters and liver mRNA levels were measured in 10–12 weeks old fasted and ad-libitum fed male C57Bl/6 J mice at several time points (each n = 5). Shading indicates light or dark cycle. Relative expression values from qPCR measurements were normalized to 36b4 expression and the values for time point 0 were set to 1. Significance was determined with a 2-way ANOVA followed by a Bonferroni posttest to determine significance for the single time points (*p < 0.05; **p < 0.01; ***p < 0.001).
Figure 2
Figure 2
Overview of microarray experiments in WAT, LIV, and SM 24 hours after onset of fasting. (A) Experimental design of the transcriptome study (WAT = white adipose tissue, LIV = liver, SM = skeletal muscle, PCA = principal component analysis). (B) The heatmap contains about 7000 probe sets differentially expressed ≥ 1.3-fold (FDR5) between fasted and fed in at least one condition. Hierarchical clustering of experiments clusters biological replicates together. Two outlier replicates were identified by principal component analysis and removed from the data set. (C) Numbers of up- and downregulated (1.3x, FDR5) microarray probe sets and RefSeq-annotated genes (in parentheses) in WAT, LIV, and SM of mice fasted for 24 hours. Additional file 1 provides detailed expression values for these genes.
Figure 3
Figure 3
Functional annotation of genes regulated in WAT 24 hours after onset of fasting reveals activation of transcription regulatory components. (A) and (B) DAVID functional clustering was performed with genes upregulated (A) or downregulated (B) by fasting (1.3x, FDR5). Shown are the numbers of unique genes (inside of bars) and the enriched clusters (left of bars with contributing DAVID domains in parentheses). The x-axis shows the cluster enrichment scores representing a geometric mean (−log) of p-values of entities in each cluster. Clusters with an enrichment score larger than three are shown. CC = cellular components, MF = molecular functions, BP = biological processes. (C) GSEA enrichment plots are generated by ranking all genes in the dataset by expression values, mapping transcription factor (TF) sub-categories (bZIP = basic leucine zippers; Fox = forkhead box), cofactors, and chromatin remodelers, and calculating a cumulative enrichment score (green line). NES = normalized enrichment score, FDR = false discovery rate.
Figure 4
Figure 4
Analyses of differentially expressed genes regulated by fasting in all three tissues revealing an involvement of p53 and Srebp signaling pathway. (A) Venn diagram of genes differentially regulated (1.3x, FDR5) in WAT, LIV, and SM and their intersections. (B) Two hundred genes differentially regulated in all three tissues were submitted to DAVID functional annotation using GO terms and KEGG pathways. Count shows the number of mapped genes and Benjamini-Hochberg’s correction was used for adjusting p-value for multiple testing. (C) Metacore mapping as obtained from analysis with the commonly regulated gene list. The thermometers display expression levels of mapped genes (1: WAT, 2: SM, 3: LIV). (D) Heatmap of p53 target genes discussed in the text. Values are log2 transformed. White dots mark highest expression between the 3 tissues. (E) and (F) Manually compiled heatmaps indicating expression levels of genes comprising the FA (E) and cholesterol biosynthesis (F) pathways. Values are log2 transformed. White dots mark highest expression between the 3 tissues.
Figure 5
Figure 5
Validation of selected candidates by qPCR. (A) Five genes differentially regulated in WAT, LIV, and SM were selected for qPCR validation of microarray results (n = 5). All differences indicated between fasted and control fed are significant with a p-value < 0.05 (two-tailed, unpaired student’s t-test). (B) Scatterplot of expression levels measured with qPCR and microarrays. Goodness of fit (r2) is calculated with linear regression. Grey shading is according to legend in A.
Figure 6
Figure 6
Ddit4 is induced during fasting and upregulated by p53 activation in cultured adipocytes. (A)In vivo regulation of Ddit4 in fasted and fed mice. Relative expression values from qPCR measurements (n = 5) were normalized to 36b4 expression and the value for the first time point was set to 1. Significance was determined with a 2-way ANOVA followed by a Bonferroni posttest to determine significance for the single time points (*p < 0.05; **p < 0.01; ***p < 0.001). Western blots were performed with tissue samples from six month old mice fed a chow diet (fed) or fasted overnight (fasted). Samples are from three littermates each. The following proteins served as loading controls (L.C.): β-actin for WAT and LIV, β-tubulin for SM. (B) 10 μM Nutlin-3, a specific p53 activator, was used to treat mature C3H10T1/2 adipocytes (day 7 of differentiation) for 6 hours. qPCR mRNA measurements (n = 3) were normalized to 36b4 expression and related to control cells (treated with DMSO). A two-tailed, unpaired student’s t-test was used to determine statistical significance (*p < 0.05; **p < 0.01; ***p < 0.001). The western blot shows data from three independent replicates treated with Nutlin-3 (+) or DMSO (−) using β–actin as loading control.
Figure 7
Figure 7
Transient overexpression of Ddit4 is sufficient to induce lipolysis in cultured adipocytes. (A)-(D) C3H10T1/2 cells were differentiated to adipocytes for 7 days. Cells were detached and electroporated in the presence of either empty vector (pMSCV) or Ddit4 overexpression vector (pDdit4). (A) 48 hours later cells were harvested to measure mRNA (left qPCR) and protein (right western blots), and supernatants were collected for glycerol and FFA assay. qPCR measurements (n = 3) were normalized to 36b4 expression and related to control cells and a two-tailed, unpaired student’s t-test was used to determine statistical significance (***p < 0.001). Western blot shows 2 biological replicates and a control treated with 100 nM rapamycin (Rapa). (B) and (C) Glycerol and FFA in cell supernatants were determined, normalized to protein content and related to measurements from control cells to yield the relative release caused by Ddit4 overexpression in unstimulated (B) and isoproterenol-stimulated (1 μM, 1 hour) (C) conditions. Significance was determined by a one-sample t-test (* p < 0.05). (D) Electroporated C3H10T1/2 adipocytes were incubated overnight with medium containing 14C-labeled deoxy-glucose. Incorporated radioactivity was counted in the lipid extract and related to controls (n = 3). A statistically significant difference was not detected by a one-sample t-test.

References

    1. Cahill GF Jr. Fuel metabolism in starvation. Annu Rev Nutr. 2006;14:1–22. doi: 10.1146/annurev.nutr.26.061505.111258. - DOI - PubMed
    1. Zechner R, Zimmermann R, Eichmann TO, Kohlwein SD, Haemmerle G, Lass A. et al.FAT SIGNALS–lipases and lipolysis in lipid metabolism and signaling. Cell Metab. 2012;14:279–291. doi: 10.1016/j.cmet.2011.12.018. - DOI - PMC - PubMed
    1. Owen OE, Morgan AP, Kemp HG, Sullivan JM, Herrera MG, Cahill GF Jr. Brain metabolism during fasting. J Clin Invest. 1967;14:1589–1595. doi: 10.1172/JCI105650. - DOI - PMC - PubMed
    1. Malik VS, Willett WC, Hu FB. Global obesity: trends, risk factors and policy implications. Nat Rev Endocrinol. 2013;14:13–27. - PubMed
    1. Johnstone AM. Fasting - the ultimate diet? Obes Rev. 2007;14:211–222. doi: 10.1111/j.1467-789X.2006.00266.x. - DOI - PubMed

Publication types

MeSH terms

Substances