Cell-specific gene expression in Anabaena variabilis grown phototrophically, mixotrophically, and heterotrophically
- PMID: 24191963
- PMCID: PMC4046671
- DOI: 10.1186/1471-2164-14-759
Cell-specific gene expression in Anabaena variabilis grown phototrophically, mixotrophically, and heterotrophically
Abstract
Background: When the filamentous cyanobacterium Anabaena variabilis grows aerobically without combined nitrogen, some vegetative cells differentiate into N2-fixing heterocysts, while the other vegetative cells perform photosynthesis. Microarrays of sequences within protein-encoding genes were probed with RNA purified from extracts of vegetative cells, from isolated heterocysts, and from whole filaments to investigate transcript levels, and carbon and energy metabolism, in vegetative cells and heterocysts in phototrophic, mixotrophic, and heterotrophic cultures.
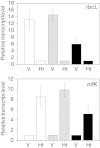
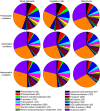
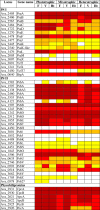
Results: Heterocysts represent only 5% to 10% of cells in the filaments. Accordingly, levels of specific transcripts in vegetative cells were with few exceptions very close to those in whole filaments and, also with few exceptions (e.g., nif1 transcripts), levels of specific transcripts in heterocysts had little effect on the overall level of those transcripts in filaments. In phototrophic, mixotrophic, and heterotrophic growth conditions, respectively, 845, 649, and 846 genes showed more than 2-fold difference (p < 0.01) in transcript levels between vegetative cells and heterocysts. Principal component analysis showed that the culture conditions tested affected transcript patterns strongly in vegetative cells but much less in heterocysts. Transcript levels of the genes involved in phycobilisome assembly, photosynthesis, and CO2 assimilation were high in vegetative cells in phototrophic conditions, and decreased when fructose was provided. Our results suggest that Gln, Glu, Ser, Gly, Cys, Thr, and Pro can be actively produced in heterocysts. Whether other protein amino acids are synthesized in heterocysts is unclear. Two possible components of a sucrose transporter were identified that were upregulated in heterocysts in two growth conditions. We consider it likely that genes with unknown function represent a larger fraction of total transcripts in heterocysts than in vegetative cells across growth conditions.
Conclusions: This study provides the first comparison of transcript levels in heterocysts and vegetative cells from heterocyst-bearing filaments of Anabaena. Although the data presented do not give a complete picture of metabolism in either type of cell, they provide a metabolic scaffold on which to build future analyses of cell-specific processes and of the interactions of the two types of cells.
Figures


Similar articles
-
Distinct and differently regulated Mo-dependent nitrogen-fixing systems evolved for heterocysts and vegetative cells of Anabaena variabilis ATCC 29413: characterization of the fdxH1/2 gene regions as part of the nif1/2 gene clusters.Mol Microbiol. 1995 Oct;18(2):357-69. doi: 10.1111/j.1365-2958.1995.mmi_18020357.x. Mol Microbiol. 1995. PMID: 8709854
-
Comparative study of thylakoid membranes in terminal heterocysts and vegetative cells from two cyanobacteria, Rivularia M-261 and Anabaena variabilis, by fluorescence and absorption spectral microscopy.Biochim Biophys Acta Bioenerg. 2017 Sep;1858(9):742-749. doi: 10.1016/j.bbabio.2017.05.007. Epub 2017 May 31. Biochim Biophys Acta Bioenerg. 2017. PMID: 28576442
-
Single-Cell Measurements of Fixation and Intercellular Exchange of C and N in the Filaments of the Heterocyst-Forming Cyanobacterium Anabaena sp. Strain PCC 7120.mBio. 2021 Aug 31;12(4):e0131421. doi: 10.1128/mBio.01314-21. Epub 2021 Aug 17. mBio. 2021. PMID: 34399619 Free PMC article.
-
Regulation of Three Nitrogenase Gene Clusters in the Cyanobacterium Anabaena variabilis ATCC 29413.Life (Basel). 2014 Dec 11;4(4):944-67. doi: 10.3390/life4040944. Life (Basel). 2014. PMID: 25513762 Free PMC article. Review.
-
Genetic responses to carbon and nitrogen availability in Anabaena.Environ Microbiol. 2019 Jan;21(1):1-17. doi: 10.1111/1462-2920.14370. Epub 2018 Oct 16. Environ Microbiol. 2019. PMID: 30066380 Review.
Cited by
-
Decoupling a novel Trichormus variabilis-Synechocystis sp. interaction to boost phycoremediation.Sci Rep. 2019 Feb 21;9(1):2511. doi: 10.1038/s41598-019-38997-7. Sci Rep. 2019. PMID: 30792472 Free PMC article.
-
Analysis of the early heterocyst Cys-proteome in the multicellular cyanobacterium Nostoc punctiforme reveals novel insights into the division of labor within diazotrophic filaments.BMC Genomics. 2014 Dec 4;15(1):1064. doi: 10.1186/1471-2164-15-1064. BMC Genomics. 2014. PMID: 25476978 Free PMC article.
-
Intercellular diffusion of a fluorescent sucrose analog via the septal junctions in a filamentous cyanobacterium.mBio. 2015 Mar 17;6(2):e02109. doi: 10.1128/mBio.02109-14. mBio. 2015. PMID: 25784700 Free PMC article.
-
β-Carboxysome bioinformatics: identification and evolution of new bacterial microcompartment protein gene classes and core locus constraints.J Exp Bot. 2017 Jun 1;68(14):3841-3855. doi: 10.1093/jxb/erx115. J Exp Bot. 2017. PMID: 28419380 Free PMC article.
-
Reconstruction of a regulated two-cell metabolic model to study biohydrogen production in a diazotrophic cyanobacterium Anabaena variabilis ATCC 29413.PLoS One. 2020 Jan 24;15(1):e0227977. doi: 10.1371/journal.pone.0227977. eCollection 2020. PLoS One. 2020. PMID: 31978122 Free PMC article.
References
-
- Thiel T. Genetic analysis of cyanobacteria. In: Bryant DA, editor. The Molecular Biology of Cyanobacteria. Dordrecht, NL: Kluwer Academic Publishers; 1994. pp. 581–611.
-
- Wolk CP, Ernst A, Elhai J. Heterocyst metabolism and development. In: Bryant DA, editor. The Molecular Biology of Cyanobacteria. Dordrecht: Kluwer Academic Publishers; 1994. pp. 769–823.
-
- Walsby AE. Cyanobacterial heterocysts: terminal pores proposed as sites of gas exchange. Trends Microbiol. 2007;15:340–349. - PubMed
Publication types
MeSH terms
Substances
LinkOut - more resources
Full Text Sources
Other Literature Sources
Molecular Biology Databases

