

Comparison of osteogenic differentiation of embryonic stem cells and primary osteoblasts revealed by responses to IL-1β, TNF-α, and IFN-γ
- PMID: 24192281
- PMCID: PMC3938933
- DOI: 10.1089/scd.2013.0336
Comparison of osteogenic differentiation of embryonic stem cells and primary osteoblasts revealed by responses to IL-1β, TNF-α, and IFN-γ
Abstract
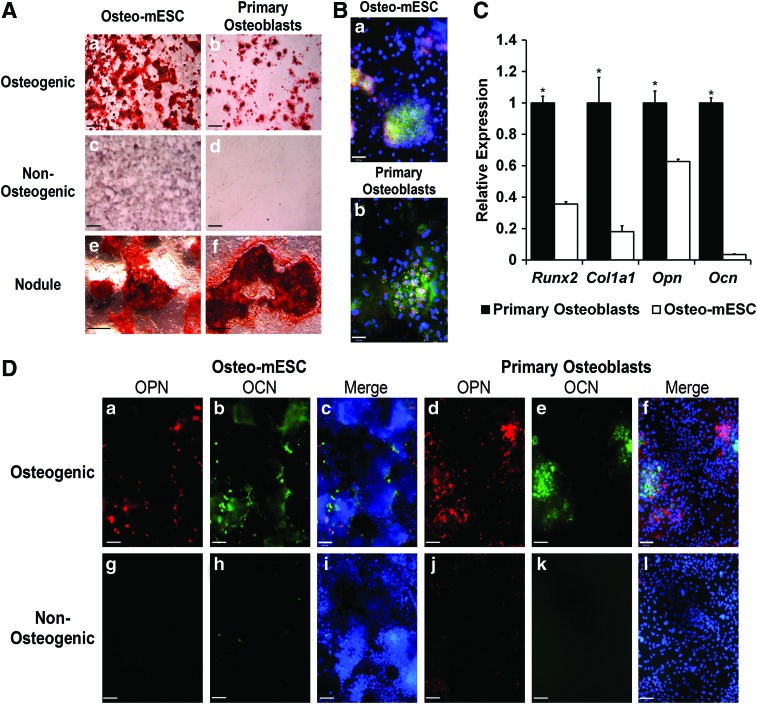
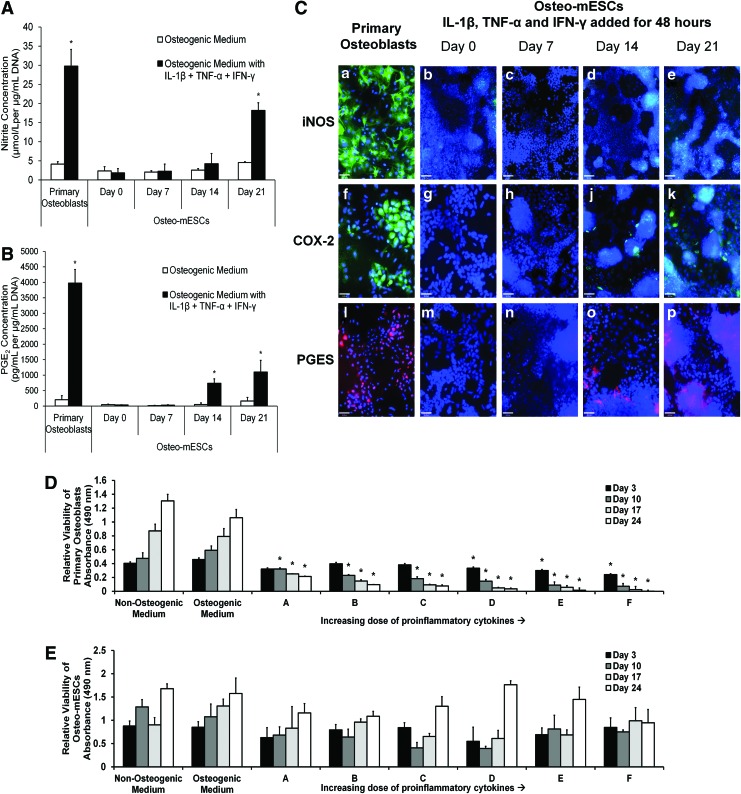
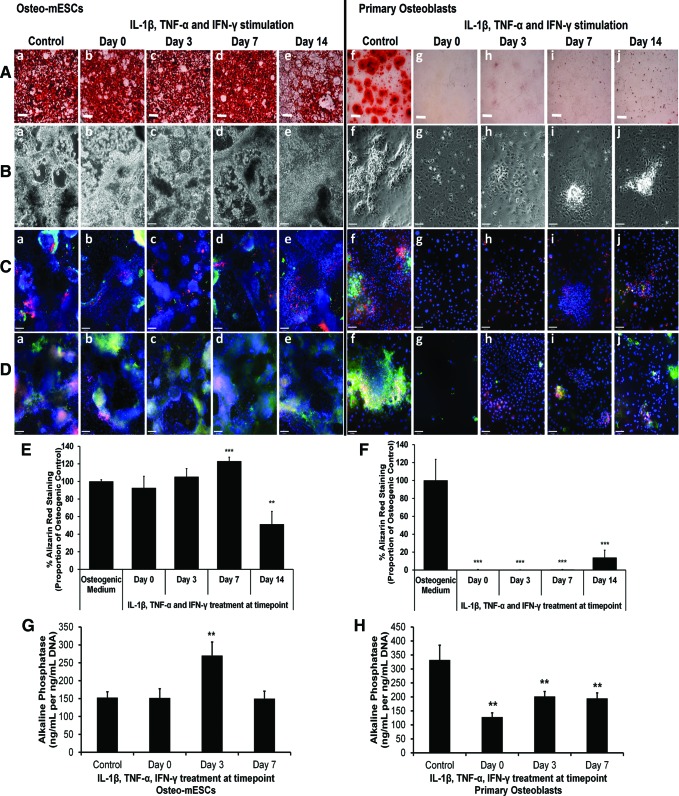
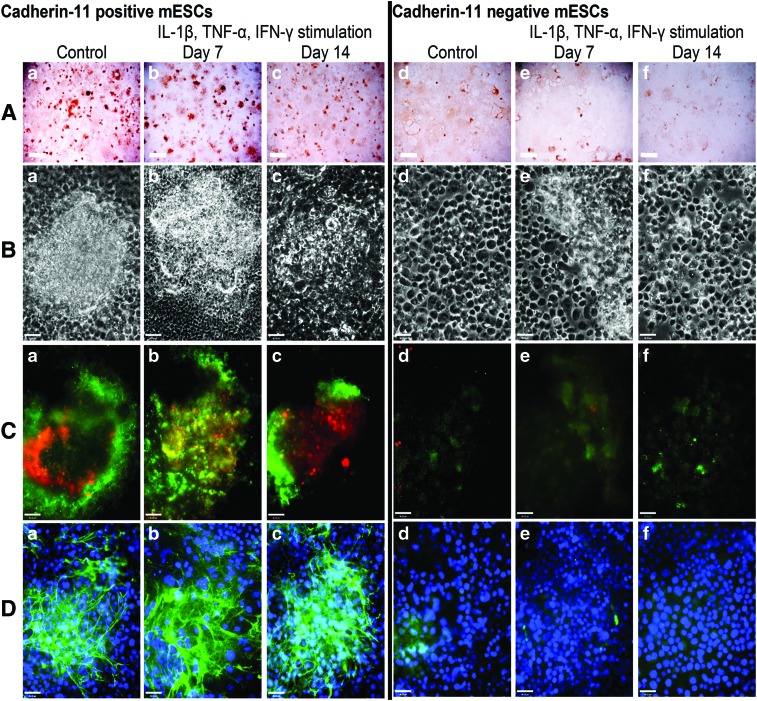
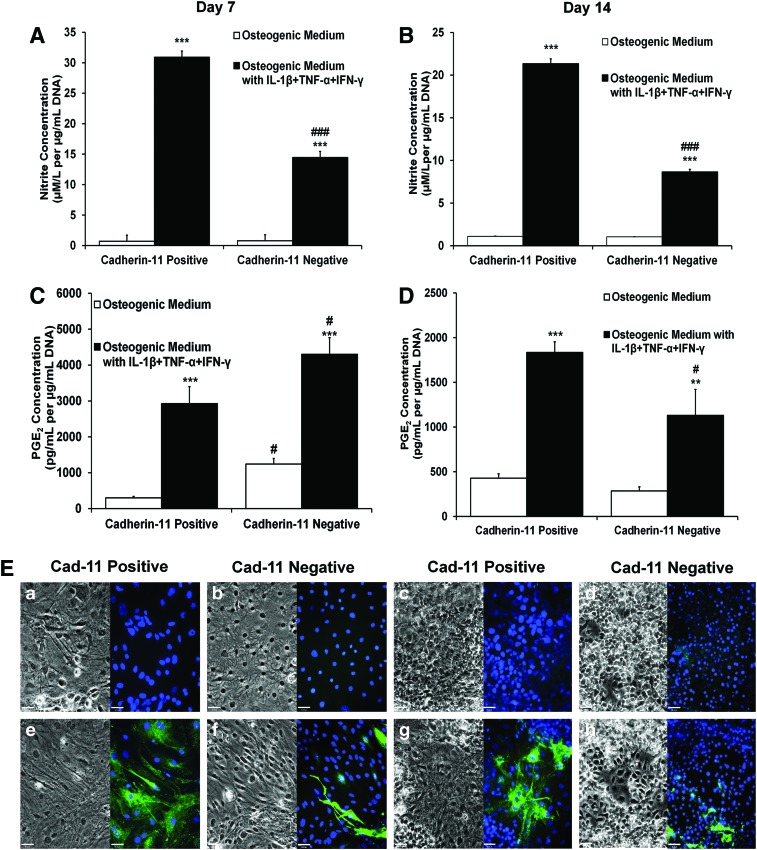
There are well-established approaches for osteogenic differentiation of embryonic stem cells (ESCs), but few show direct comparison with primary osteoblasts or demonstrate differences in response to external factors. Here, we show comparative analysis of in vitro osteogenic differentiation of mouse ESC (osteo-mESC) and mouse primary osteoblasts. Both cell types formed mineralized bone nodules and produced osteogenic extracellular matrix, based on immunostaining for osteopontin and osteocalcin. However, there were marked differences in the morphology of osteo-mESCs and levels of mRNA expression for osteogenic genes. In response to the addition of proinflammatory cytokines interleukin-1β, tumor necrosis factor-α, and interferon-γ to the culture medium, primary osteoblasts showed increased production of nitric oxide (NO) and prostaglandin E2 (PGE2) at early time points and decreases in cell viability. In contrast, osteo-mESCs maintained viability and did not produce NO and PGE2 until day 21. The formation of bone nodules by primary osteoblasts was reduced markedly after cytokine stimulation but was unaffected in osteo-mESCs. Cell sorting of osteo-mESCs by cadherin-11 (cad-11) showed clear osteogenesis of cad-11(+) cells compared to unsorted osteo-mESCs and cad-11(-) cells. Moreover, the cad-11(+) cells showed a significant response to cytokines, similar to primary osteoblasts. Overall, these results show that while osteo-mESC cultures, without specific cell sorting, show characteristics of osteoblasts, there are also marked differences, notably in their responses to cytokine stimuli. These findings are relevant to understanding the differentiation of stem cells and especially developing in vitro models of disease, testing new drugs, and developing cell therapies.
Figures
Similar articles
-
Enhanced derivation of osteogenic cells from murine embryonic stem cells after treatment with HepG2-conditioned medium and modulation of the embryoid body formation period: application to skeletal tissue engineering.Tissue Eng. 2006 Jun;12(6):1381-92. doi: 10.1089/ten.2006.12.1381. Tissue Eng. 2006. PMID: 16846337
-
Osteogenic induction from marmoset embryonic stem cells cultured in feeder-dependent and feeder-independent conditions.Osteoporos Int. 2014 Apr;25(4):1255-66. doi: 10.1007/s00198-013-2566-4. Epub 2014 Feb 15. Osteoporos Int. 2014. PMID: 24531422
-
Exogenous nitric oxide enhances calcification in embryonic stem cell-derived osteogenic cultures.Differentiation. 2015 Mar-Apr;89(3-4):97-103. doi: 10.1016/j.diff.2015.02.001. Epub 2015 Apr 27. Differentiation. 2015. PMID: 25929821
-
[Advance in differentiation of embryonic stem cells into osteoblasts in vitro].Zhongguo Xiu Fu Chong Jian Wai Ke Za Zhi. 2007 Dec;21(12):1381-3. Zhongguo Xiu Fu Chong Jian Wai Ke Za Zhi. 2007. PMID: 18277689 Review. Chinese.
-
Effects of different physical factors on osteogenic differentiation.Biochimie. 2023 Apr;207:62-74. doi: 10.1016/j.biochi.2022.10.020. Epub 2022 Nov 3. Biochimie. 2023. PMID: 36336107 Review.
Cited by
-
Pluripotent stem cells as a source of osteoblasts for bone tissue regeneration.Biomaterials. 2019 Mar;196:31-45. doi: 10.1016/j.biomaterials.2018.02.009. Epub 2018 Feb 5. Biomaterials. 2019. PMID: 29456164 Free PMC article.
-
Emerging Landscape of Osteogenesis Imperfecta Pathogenesis and Therapeutic Approaches.ACS Pharmacol Transl Sci. 2024 Jan 2;7(1):72-96. doi: 10.1021/acsptsci.3c00324. eCollection 2024 Jan 12. ACS Pharmacol Transl Sci. 2024. PMID: 38230285 Free PMC article. Review.
-
The underdeveloped innate immunity in embryonic stem cells: The molecular basis and biological perspectives from early embryogenesis.Am J Reprod Immunol. 2019 Feb;81(2):e13089. doi: 10.1111/aji.13089. Epub 2019 Jan 28. Am J Reprod Immunol. 2019. PMID: 30614149 Free PMC article.
-
Investigation of localized delivery of diclofenac sodium from poly(D,L-lactic acid-co-glycolic acid)/poly(ethylene glycol) scaffolds using an in vitro osteoblast inflammation model.Tissue Eng Part A. 2015 Jan;21(1-2):362-73. doi: 10.1089/ten.TEA.2014.0100. Epub 2014 Oct 7. Tissue Eng Part A. 2015. PMID: 25104438 Free PMC article.
-
The Molecular Basis for the Lack of Inflammatory Responses in Mouse Embryonic Stem Cells and Their Differentiated Cells.J Immunol. 2017 Mar 1;198(5):2147-2155. doi: 10.4049/jimmunol.1601068. Epub 2017 Jan 27. J Immunol. 2017. PMID: 28130495 Free PMC article.
References
-
- Rose F. and Oreffo ROC. (2002). Bone tissue engineering: hope vs hype. Biochem Biophys Res Commun 292:1–7 - PubMed
-
- Bielby RC, Boccaccini AR, Polak JM. and Buttery LDK. (2004). In vitro differentiation and in vivo mineralization of osteogenic cells derived from human embryonic stem cells. Tissue Eng 10:1518–1525 - PubMed
-
- de Peppo GM, Sjovall P, Lenneras M, Strehl R, Hyllner J, Thomsen P. and Karlsson C. (2010). Osteogenic potential of human mesenchymal stem cells and human embryonic stem cell-derived mesodermal progenitors: a tissue engineering perspective. Tissue Eng Part A 16:3413–3426 - PubMed
Publication types
MeSH terms
Substances
LinkOut - more resources
Full Text Sources
Other Literature Sources
Research Materials
Miscellaneous