. 2014 Mar 15;30(6):768-74.
doi: 10.1093/bioinformatics/btt611. Epub 2013 Nov 4.

WaveCNV: allele-specific copy number alterations in primary tumors and xenograft models from next-generation sequencing

Affiliations

WaveCNV: allele-specific copy number alterations in primary tumors and xenograft models from next-generation sequencing

Carson Holt et al. Bioinformatics. .

Abstract

Motivation: Copy number variations (CNVs) are a major source of genomic variability and are especially significant in cancer. Until recently microarray technologies have been used to characterize CNVs in genomes. However, advances in next-generation sequencing technology offer significant opportunities to deduce copy number directly from genome sequencing data. Unfortunately cancer genomes differ from normal genomes in several aspects that make them far less amenable to copy number detection. For example, cancer genomes are often aneuploid and an admixture of diploid/non-tumor cell fractions. Also patient-derived xenograft models can be laden with mouse contamination that strongly affects accurate assignment of copy number. Hence, there is a need to develop analytical tools that can take into account cancer-specific parameters for detecting CNVs directly from genome sequencing data.

Results: We have developed WaveCNV, a software package to identify copy number alterations by detecting breakpoints of CNVs using translation-invariant discrete wavelet transforms and assign digitized copy numbers to each event using next-generation sequencing data. We also assign alleles specifying the chromosomal ratio following duplication/loss. We verified copy number calls using both microarray (correlation coefficient 0.97) and quantitative polymerase chain reaction (correlation coefficient 0.94) and found them to be highly concordant. We demonstrate its utility in pancreatic primary and xenograft sequencing data.

Availability and implementation: Source code and executables are available at https://github.com/WaveCNV. The segmentation algorithm is implemented in MATLAB, and copy number assignment is implemented Perl.

Contact: lakshmi.muthuswamy@gmail.com

Supplementary information: Supplementary data are available at Bioinformatics online.


Figures
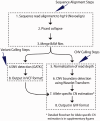
Fig. 1.
Fig. 1.
Flow chart showing the analysis procedure
Fig. 2.
Fig. 2.
Detection of signal discontinuities using wavelet transformed and de-noised signal over a 16 kb region. Top panel shows the raw read depth (gray) and the denoised signal (red). Bottom panel illustrates copy number break points where the coefficient of the maximal scale intersects those of the finest scale. The y-axis is the squared approximation wavelet coefficient, and x-axis is the genomic position in megabases
Fig. 3.
Fig. 3.
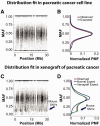
MAF distribution of SNVs in a 30 Mb region of chr1. (A) MAF density in a pancreatic cancer cell line; (B) observed (red) and normal fitted expect (blue) distribution curves of MAF for pancreatic cancer cell line; (C) MAF density in a pancreatic xenograft model; (D) observed (red), normal fitted expect (blue) and expect with mouse contamination (green) for pancreatic xenograft model
Fig. 4.
Fig. 4.
Modeling for aneuploidy. (A) The expected segment median coverage for a diploid genome is estimated using kernel density estimation. This value then serves to define a range for estimating the sample base coverage (coverage of copy number 1). (B) The normalized likelihood of the observed coverage (red line) as well as the normalized residual sum of squares value (rss) for all MAF distribution fits (blue line) are calculated for each candidate base coverage (assuming ploidy range 1–4). The base coverage that produces the maximum separation between likelihood and rss (yellow line) is then selected. (C and D) show the expected segment median coverage and the base coverage selected for a triploid genome
Fig. 5.
Fig. 5.
Validation of copy number calls using three methods. (A) Verification of 80 CNV loci by qPCR on a pancreatic cancer genome. Copy numbers from qPCR were estimated based on threshold cycle (Ct) values. The Pearson correlation coefficient is 0.94. (B) Verification of 473 somatic CNVs on the whole-genome using Illumina Human Omni 1Million microarray. Shown here is the concordance between intensity ratios in microarray to WaveCNV CN. The Pearson correlation coefficient is 0.86. (C) Verification of 468 somatic CNVs on the whole genome using Nimblegen 2.1 Million aCGH microarray. Shown here is the concordance between aCGH intensities ratio in microarray to WaveCNV CN. The Pearson correlation coefficient is 0.97

References

    1. Abyzov A, et al. CNVnator: an approach to discover, genotype, and characterize typical and atypical CNVs from family and population genome sequencing. Genome Res. 2011;21:974–984. - PMC - PubMed
    1. Baslan T, et al. Genome-wide copy number analysis of single cells. Nat. Protoc. 2012;7:1024–1041. - PMC - PubMed
    1. Biankin AV, et al. Pancreatic cancer genomes reveal aberrations in axon guidance pathway genes. Nature. 2012;491:399–405. - PMC - PubMed
    1. Carter SL, et al. Absolute quantification of somatic DNA alterations in human cancer. Nat. Biotechnol. 2012;30:413–421. - PMC - PubMed
    1. Coifman RR, Donoho DL. Translation-invariant de-noising. In: Antoniadis A, Oppenheim G, editors. Wavelets and Statistics. New York: Springer-Verlag; 1995.

Publication types