Review
. 2014 Jan;34(1):2-18.
doi: 10.1038/jcbfm.2013.188. Epub 2013 Nov 6.

Selective neuronal loss in ischemic stroke and cerebrovascular disease

Affiliations
Review

Selective neuronal loss in ischemic stroke and cerebrovascular disease

Jean-Claude Baron et al. J Cereb Blood Flow Metab. 2014 Jan.

Abstract

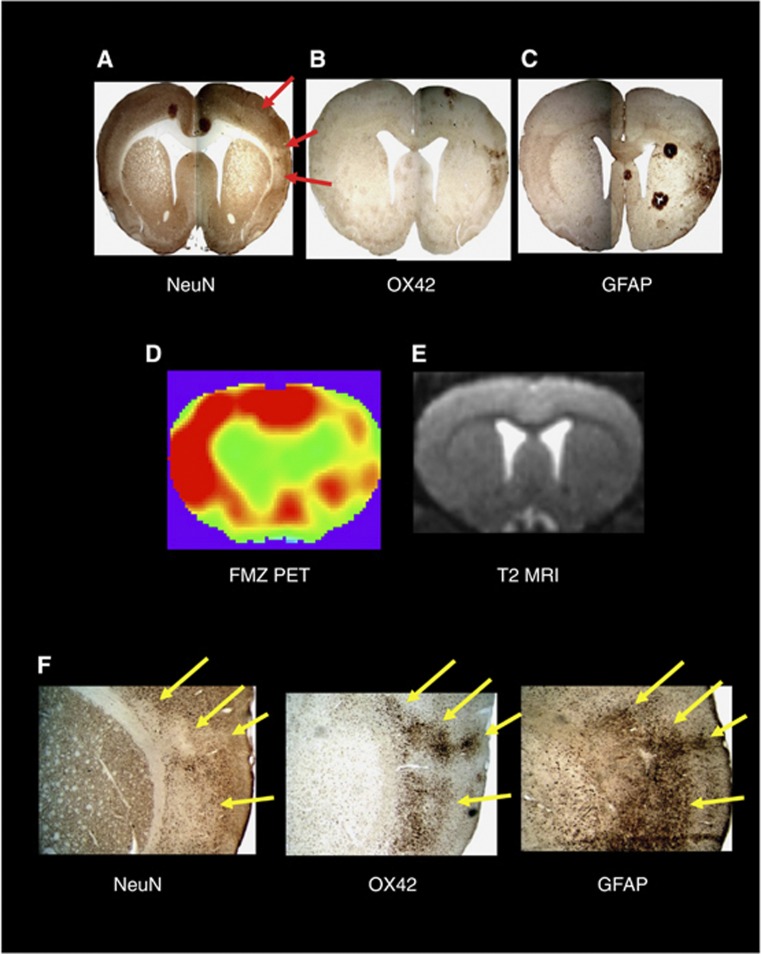
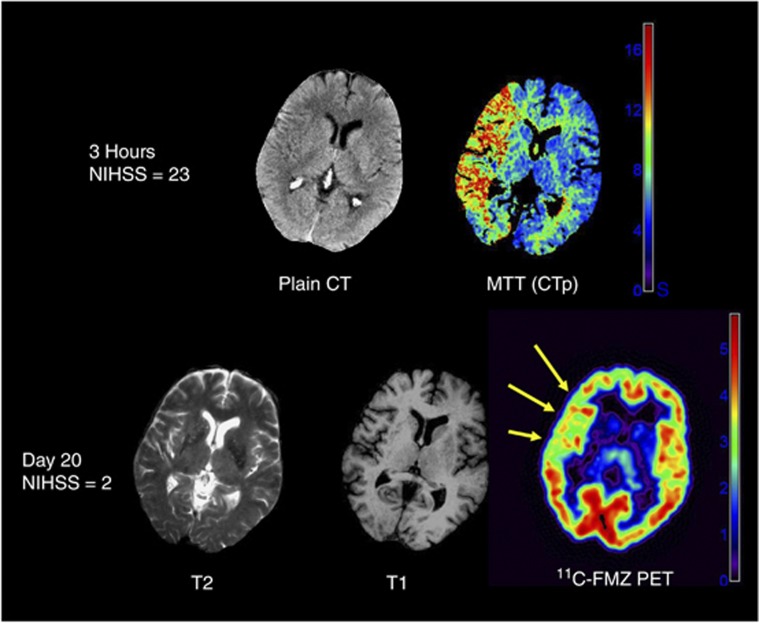
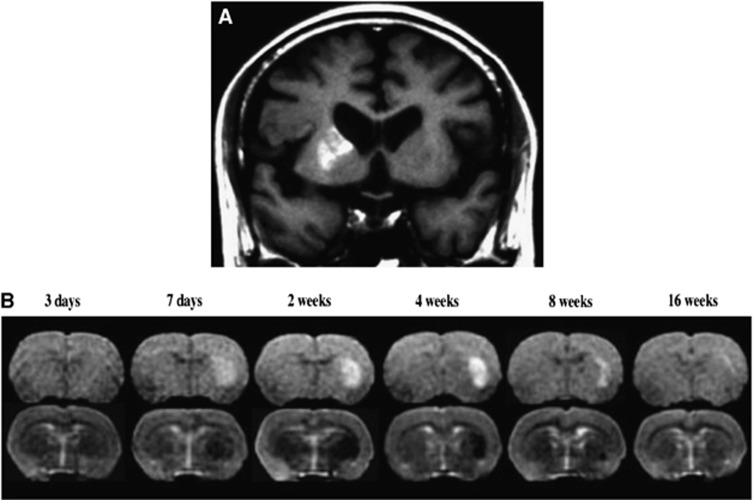
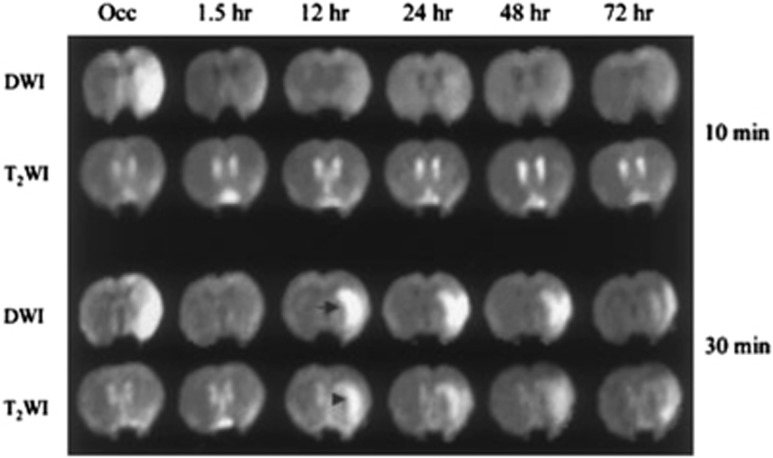
As a sequel of brain ischemia, selective neuronal loss (SNL)-as opposed to pannecrosis (i.e. infarction)-is attracting growing interest, particularly because it is now detectable in vivo. In acute stroke, SNL may affect the salvaged penumbra and hamper functional recovery following reperfusion. Rodent occlusion models can generate SNL predominantly in the striatum or cortex, showing that it can affect behavior for weeks despite normal magnetic resonance imaging. In humans, SNL in the salvaged penumbra has been documented in vivo mainly using positron emission tomography and (11)C-flumazenil, a neuronal tracer validated against immunohistochemistry in rodent stroke models. Cortical SNL has also been documented using this approach in chronic carotid disease in association with misery perfusion and behavioral deficits, suggesting that it can result from chronic or unstable hemodynamic compromise. Given these consequences, SNL may constitute a novel therapeutic target. Selective neuronal loss may also develop at sites remote from infarcts, representing secondary 'exofocal' phenomena akin to degeneration, potentially related to poststroke behavioral or mood impairments again amenable to therapy. Further work should aim to better characterize the time course, behavioral consequences-including the impact on neurological recovery and contribution to vascular cognitive impairment-association with possible causal processes such as microglial activation, and preventability of SNL.


Figures

Figure 1
Figure 1
(A) Example of patchy cortical selective neuronal loss (SNL; red arrows) obtained 28 days after 45-minute distal middle cerebral artery (MCA) occlusion in a spontaneously hypertensive rat using immunohistochemistry (IHC) with NeuN (coronal section at bregma +1.00 mm). (B) and (C) OX42 and glial fibrillary acidic protein (GFAP)-stained sections at the same anatomical level, respectively, obtained in the same rat as (A), illustrating the close topographical relationship between the patches of NeuN loss and the areas of increased OX42 and GFAP staining, indicating a close association between SNL, microglial activation, and astrocytosis. (D) and (E) Co-registered 11C-flumazenil (FMZ) positron emission tomography (PET) and T2-weighted magnetic resonance imaging (MRI) coronal sections from the same rat and at the corresponding level as the IHC sections as A, B, and C, obtained 28 days after MCAo, illustrating the excellent topographical concordance between SNL and reduced FMZ binding (acknowledging the difference in spatial resolution), and the normality of T2-weighted MRI in areas of SNL; (F) high-resolution ( × 40) NeuN, OX42, and GFAP stains from the same rat, illustrating the striking colocalization of SNL, microglial activation, and astrocytosis at the microscopic level. The arrows point to four separate patches of SNL and their matching areas of microglial activation and astrocytosis. Modified from Ejaz et al, with permission.
Figure 2
Figure 2
Illustrative images from one patient with reduced 11C-flumazenil (FMZ) binding potential (BPND) in the initially severely ischemic but eventually non-infarcted middle cerebral artery (MCA) cortex. Shown is one representative slice from the co-registered acute plain CT, CT perfusion (mean-transit time, MTT) map (both obtained 120 minutes after stroke onset), and outcome T2- and T1-weighted magnetic resonance imaging (MRI) and FMZ BPND map (obtained 20 days later). This patient had a severe MCA stroke (NIH stroke scale score 23 at admission) but made a rapid and excellent spontaneous recovery in a few days (NIH stroke scale at day 20: 2), with only a small basal ganglia infarct on follow-up MRI, but showed extensive and statistically significant reductions in BPND in the MCA cortical ribbon. The pseudo-color scales show the range of MTT (seconds) and BPND (standard units). NIHSS, National Institutes of Health Stroke Scale (clinical scale that ranges from 0, no deficit, to 42, maximal deficit). From Guadagno et al, with permission.
Figure 3
Figure 3
Delayed ischemic T1 hyperintensity representing selective neuronal loss and glial proliferation after brief and/or mild ischemia. (A) Delayed ischemic hyperintensity on T1-weighted magnetic resonance imaging in the striatum in a patient 10 days after brief focal ischemia. (B) Chronological changes in T1- and T2-weighted (top and bottom rows, respectively) magnetic resonance imaging (MRI) in one rat after 15-minute proximal middle cerebral artery occlusion. Modified from original Figures 1 and 2A in Fujioka et al.
Figure 4
Figure 4
Representative diffusion-weighted images (DWI) and T2-weighted images (T2WI) at different time points after 10-minute (top) and 30-minute (bottom) middle cerebral artery (MCA) occlusion in Sprague–Dawley rats. In both groups, DWI hyperintensity was seen during occlusion in the lateral caudoputamen and overlying cortex and completely disappeared 1.5 hours after reperfusion. The DWI and T2WI were normal thereafter in the 10-minute group, but secondary DWI lesions (arrow), accompanied by hyperintensity on T2WI (arrowhead), occurred in the 30-minute group at 12 hours after reperfusion and were still present at 72 hours. Note that secondary DWI lesions first developed in the caudoputamen and then gradually spread to the cortex. Occ indicates during occlusion. Histopathology showed moderate selective neuronal death (4% to 28% necrotic neurons) in the caudoputamen with no instance of infarction in the 10-minute group, and massive neuronal death or pannecrosis in all 30-minute group subjects (88% to 100% necrotic neurons). From Li et al, with permission.
Figure 5
Figure 5
Linear correlation (P<0.0001) between NeuN scores and relative cerebral blood flow (rCBF) during occlusion (affected/unaffected side ratios), obtained in two different sets of rats, across a fixed template of 44 regions of interest (ROIs). Nonlinear 1/x regression, shown as dotted line, provided better fit and depicts a sharp rise in SNL for rCBF <40%, i.e. the expected penumbral threshold. Modified from Hughes et al, with permission.
Figure 6
Figure 6
Idealized representation of the classical core/penumbra model, but including selective neuronal loss. From Guadagno et al, with permission.
Figure 7
Figure 7
(A) Example of pseudo-columnar selective neuronal loss (SNL) assessed using NeuN 14 days after 45-minute distal MCA occlusion in a spontaneously hypertensive rat, and OX42 immunostain obtained at the same coronal level illustrating the matching microglial activation (MA); (B) linear correlation (P<0.0001) between NeuN SNL and OX42 MA scores obtained in a template of 44 regions of interest (data averaged across five rats from the same study).
Figure 8
Figure 8
Secondary exofocal neurodegeneration after striatal infarction in mice. (A) At 24 hours after 30-minute middle cerebral artery occlusion (MCAo)/reperfusion, a T2 hyperintensity demarcates the ischemic left striatum. This characteristic magnetic resonance (MR) signal of the primary lesion fades during the first week after MCAo. (B, C, D) At 7 days after MCAo, an activation of Iba1-expressing microglia in the ipsilateral (C) as compared with the contralateral (B) midbrain was observed. This coincided with a secondary T2 hyperintensity that emerged toward the end of the first week after stroke (arrow in panel D). (E) Loss of tyrosine hydroxylase-expressing neurons on the stroke side in the midbrain at 16 weeks after experimental ischemia (adapted from Kronenberg et al.)
Figure 9
Figure 9
Abnormal lesion signal normalization in remote areas at follow-up: brain infarcts in the middle cerebral artery (MCA) territory affecting the striatum on coronal T2w magnetic resonance imaging (MRI) on day 10 in two selected patients (A, F). Hyperintense signal in the ipsilateral midbrain is evident on day 10 in axial diffusion-weighted imaging (DWI) (B, G) and 2 adjacent coronary T2w sections (C, H), which disappeared in corresponding sections on day 72 (D, E) and day 90 (I, J).
Figure 10
Figure 10
Benzodiazepine receptor binding and misery perfusion. Upper row: examples of positron emission tomography (PET) images showing decreases in 11C-flumazenil-binding potential (FMZ-BP), cerebral blood flow (CBF), and CMRO2 with increased oxygen extraction fraction (OEF) in a patient with left (L) internal carotid artery occlusion on magnetic resonance angiography(MRA), left) who showed internal borderzone infarction on the corresponding MRI images. Lower row: Three-dimensional-SSP images and Z-score maps showing a decrease of FMZ-BP in the left hemisphere. Modified from Yamauchi et al.

References

    1. Graham DI, Peter PL.Greenfield's Neuropathology7th ednArnold publisher: London; 20021251–258.
    1. Garcia JH, Lassen NA, Weiller C, Sperling B, Nakagawara J. Ischemic stroke and incomplete infarction. Stroke. 1996;27:761–765. - PubMed
    1. DeGirolami U, Crowell RM, Marcoux FW. Selective necrosis and total necrosis in focal cerebral ischemia. Neuropathologic observations on experimental middle cerebral artery occlusion in the macaque monkey. J Neuropathol Exp Neurol. 1984;43:57–71. - PubMed
    1. Auer RN, Siesjo BK. Biological differences between ischemia, hypoglycemia, and epilepsy. Ann Neurol. 1988;24:699–707. - PubMed
    1. Spielmeyer W. Zur pathogenese örtlich elektiver gehirnveränderungen. Z Ges Neurol Psych. 1925;99:756–776.

Publication types

MeSH terms