. 2014 Jan 10;4(1):49-62.
doi: 10.1534/g3.113.008607.

The Aspergillus nidulans ATM kinase regulates mitochondrial function, glucose uptake and the carbon starvation response

Affiliations

The Aspergillus nidulans ATM kinase regulates mitochondrial function, glucose uptake and the carbon starvation response

Nadia Graciele Krohn et al. G3 (Bethesda). .

Abstract

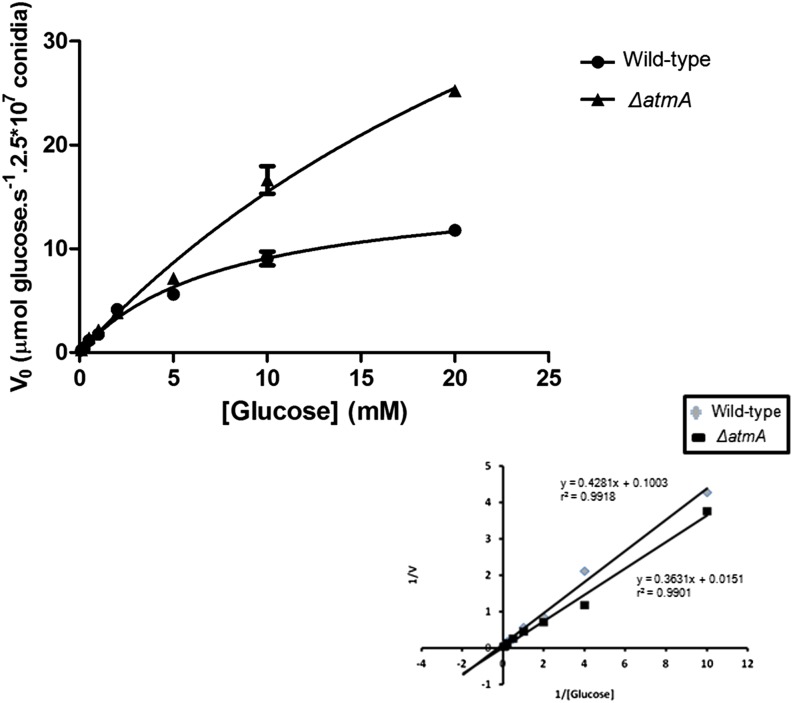
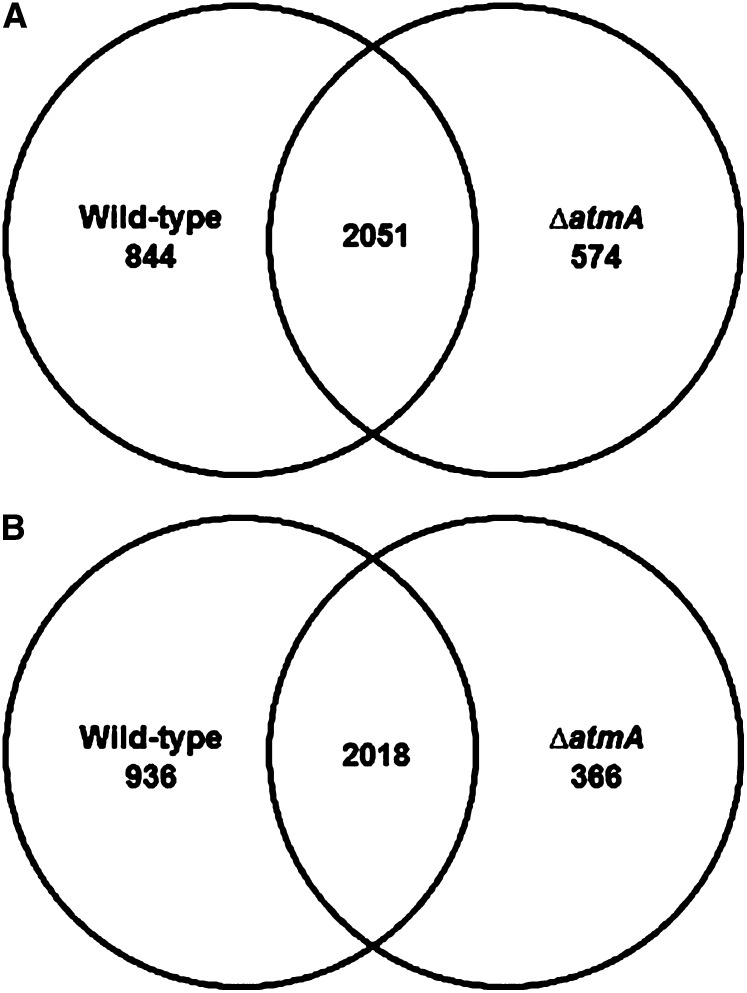
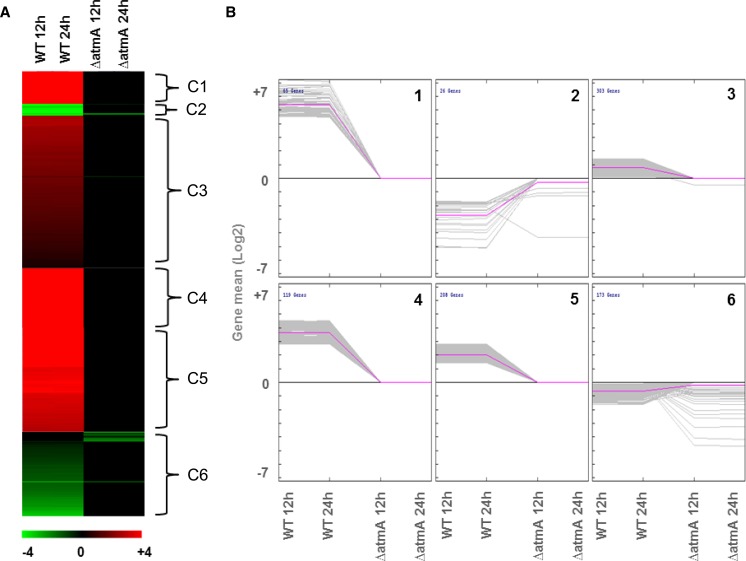
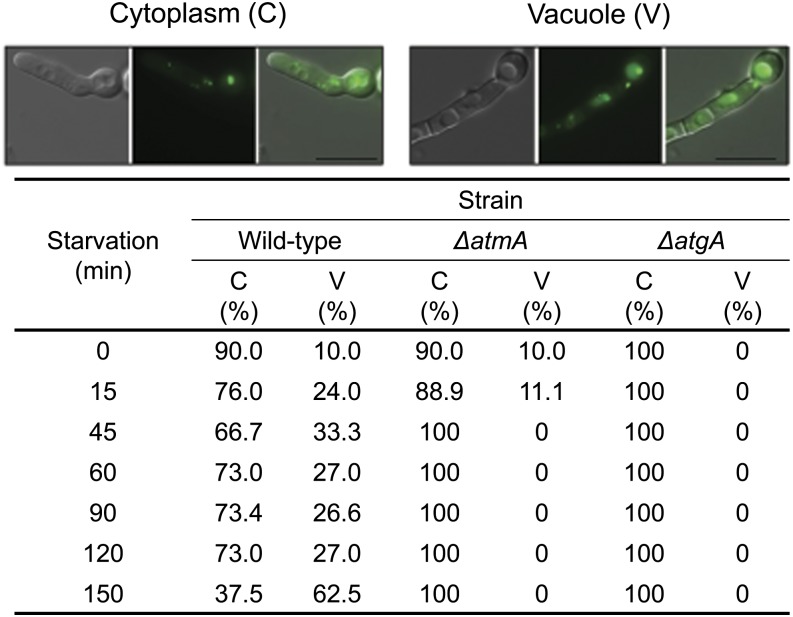
Mitochondria supply cellular energy and also perform a role in the adaptation to metabolic stress. In mammals, the ataxia-telangiectasia mutated (ATM) kinase acts as a redox sensor controlling mitochondrial function. Subsequently, transcriptomic and genetic studies were utilized to elucidate the role played by a fungal ATM homolog during carbon starvation. In Aspergillus nidulans, AtmA was shown to control mitochondrial function and glucose uptake. Carbon starvation responses that are regulated by target of rapamycin (TOR) were shown to be AtmA-dependent, including autophagy and hydrolytic enzyme secretion. AtmA also regulated a p53-like transcription factor, XprG, inhibiting starvation-induced XprG-dependent protease secretion and cell death. Thus, AtmA possibly represents a direct or indirect link between mitochondrial stress, metabolism, and growth through the influence of TOR and XprG function. The coordination of cell growth and division with nutrient availability is crucial for all microorganisms to successfully proliferate in a heterogeneous environment. Mitochondria supply cellular energy but also perform a role in the adaptation to metabolic stress and the cross-talk between prosurvival and prodeath pathways. The present study of Aspergillus nidulans demonstrated that AtmA also controlled mitochondrial mass, function, and oxidative phosphorylation, which directly or indirectly influenced glucose uptake. Carbon starvation responses, including autophagy, shifting metabolism to the glyoxylate cycle, and the secretion of carbon scavenging enzymes were AtmA-dependent. Transcriptomic profiling of the carbon starvation response demonstrated how TOR signaling and the retrograde response, which signals mitochondrial dysfunction, were directly or indirectly influenced by AtmA. The AtmA kinase was also shown to influence a p53-like transcription factor, inhibiting starvation-induced XprG-dependent protease secretion and cell death. Therefore, in response to metabolic stress, AtmA appears to perform a role in the regulation of TOR signaling, involving the retrograde and SnfA pathways. Thus, AtmA may represent a link between mitochondrial function and cell cycle or growth, possibly through the influence of the TOR and XprG function.

Keywords: ATM kinase; autophagy; cell death; glucose starvation.


Figures

Figure 1
Figure 1
The ΔatmA strain has increased mitochondrial mass. (A) Fluorescent microscopy for both wild-type and ΔatmA mitochondria stained with Mito Tracker Green and Nonyl Acridine Orange. (B) Flow cytometric analyses (FCA) for both dyes are shown. The results are expressed as mean ± SD and were considered statistically different (*), with P < 0.05 determined by Student t test using GraphPad Prism software version 5 (GraphPad Software). FAU, fluorescent arbitrary units. (C) Western blot (upper panel) of the cytochrome c of the total proteins (lower panel) extracted from the wild-type and ΔatmA strains grown for 16 hr in MM.
Figure 2
Figure 2
Glucose uptake is impaired in the ΔatmA mutant strain. Km values for glucose in the A. nidulans wild-type and ΔatmA mutant strains. Uptake rates for [14C] glucose germinating conidia of the wild-type and ΔatmA mutant strains were determined at the indicated substrate concentrations at pH 7.0. (n = 3; ±SD).
Figure 3
Figure 3
Venn diagrams of the wild-type and ΔatmA transcriptomes. The overlap of genes exhibiting a statistically significant (P < 0.001) increase (A) or decrease (B) in expression after carbon starvation compared to the equivalent transcriptomes when grown on glucose containing media.
Figure 4
Figure 4
Expression pattern of the genes differentially expressed between the wild-type and ΔatmA strains after carbon starvation. (A) Heat map of the six gene clusters (C1 to C6) identified via KMC analysis as demonstrating a similar expression pattern. (B) Expression profile (mean log2 fold change) of the genes within the six clusters.
Figure 5
Figure 5
The atmA positively controls autophagy. A. nidulans AtgH::GFP germlings previously grown for 12 hr in MM plus 2% glucose were transferred to MM without any carbon source for 15, 30, and 60 min. Bars: 10 µm. The AtgH::GFP, ΔatmA AtgH::GFP, and ΔatgA AtgH::GFP grown for 12 hr in MM plus 2% glucose (time zero) and transferred to MM without any carbon source for 15, 45, 60, 90, 120, and 150 min. Bars: 10 µm.
Figure 6
Figure 6
AtmA genetically interacts with XprG. (A) The semi-quantitative determination of protease secretion after growth on MM plus milk as the sole carbon source for the wild-type, ΔatmA, ΔxprG, xprG1, ΔatmA ΔxprG, and ΔatmA xprG1 mutant strains. (B) Quantitative evaluation of protease activity of 48-hr carbon-starved cultures for the wild-type, ΔatmA, ΔxprG, xprG1, ΔatmA ΔxprG, and ΔatmA xprG1 mutant strains. (C) Left panel shows real-time RT-PCR for the xprG gene. The wild-type and alcA::xprG mutant strains were grown in liquid MM containing either 2% glycerol and 100 mM threonine or 4% glucose for 24 hr at 37°C. Right panel shows the semi-quantitative determination of protease secretion after growth on MM plus milk as the sole carbon source supplemented with 10 mM cyclopentanone for the wild-type, alcA::atmA, and ΔatmA alcA::xprG mutant strains. The numbers on the left bottom side of each panel in (A) and in (B) represent the clearance index (clearance zone diameter/ colony diameter).
Figure 7
Figure 7
ROS production by ΔatmA and ΔxprG mutant strains. Intracellular ROS levels after 1-hr carbon starvation determined via the oxidant-sensitive probe 5-(and 6)-chloromethyl-2′,7′-dichlorofluorescin diacetate CM-H2DCFDA. AFU, arbitrary fluorescence units.
Figure 8
Figure 8
TUNEL assay to detect DNA fragmentation in the wild-type and ΔatmA strains evaluating the influence of 0, 12, and 24 hr of starvation. Nuclei were visualized by Hoescht staining. (A) Wild-type and (B) ΔatmA mutant strains. Bars: 10 µm.
Figure 9
Figure 9
Detection of necrosis using propidium iodide (PI) staining for wild-type, ΔatmA, and ΔxprG strains after 0, 12, and 24 hr of starvation. Nuclei were visualized by Hoescht staining. (A) Wild-type, (B) ΔatmA, and (C) ΔxprG. Bars: 10 µm.

References

    1. Alexander A., Kim J., Walker C. L., 2010a ATM engages the TSC2/mTORC1 signaling node to regulate autophagy. Autophagy 6: 672–673. - PMC - PubMed
    1. Ambrose M., Gatti R. A., 2013. Pathogenesis of ataxia-telangiectasia: the next generation of ATM functions. Blood 121: 4036–4045. - PMC - PubMed
    1. Armata H. L., Golebiowski D., Jung D. Y., Ko H. J., Kim J. K., et al. , 2010. Requirement of the ATM/p53 tumor suppressor pathway for glucose homeostasis. Mol. Cell. Biol. 30: 5787–5794. - PMC - PubMed
    1. Banin S., Shieh S., Taya Y., Anderson C. W., Chessa L., et al. , 1998. Enhanced phosphorylation of p53 by ATM in response to DNA damage. Science 281: 1674–1677. - PubMed
    1. Barbet N. C., Schneider U., Helliwell S. B., Stansfield I., Tuite M. F., et al. , 1996. TOR controls translation initiation and early G1 progression in yeast. Mol. Biol. Cell 7: 25–42. - PMC - PubMed

Publication types

MeSH terms