

Unique temporal and spatial biomolecular emission profile on individual zinc oxide nanorods
- PMID: 24193145
- PMCID: PMC3874594
- DOI: 10.1039/c3nr05031a
Unique temporal and spatial biomolecular emission profile on individual zinc oxide nanorods
Abstract
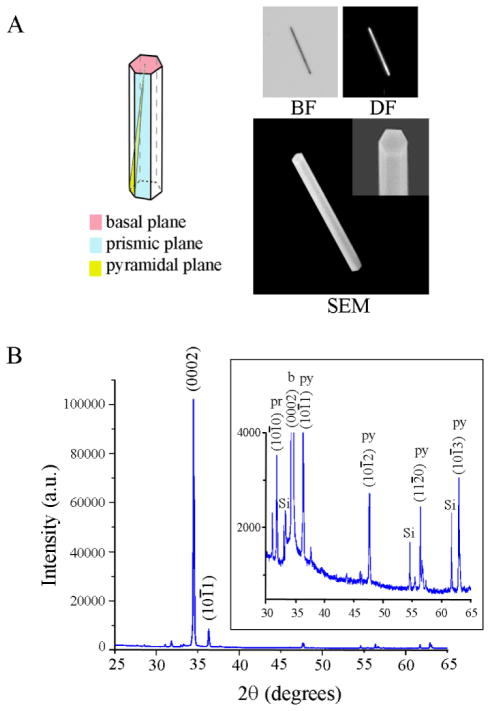
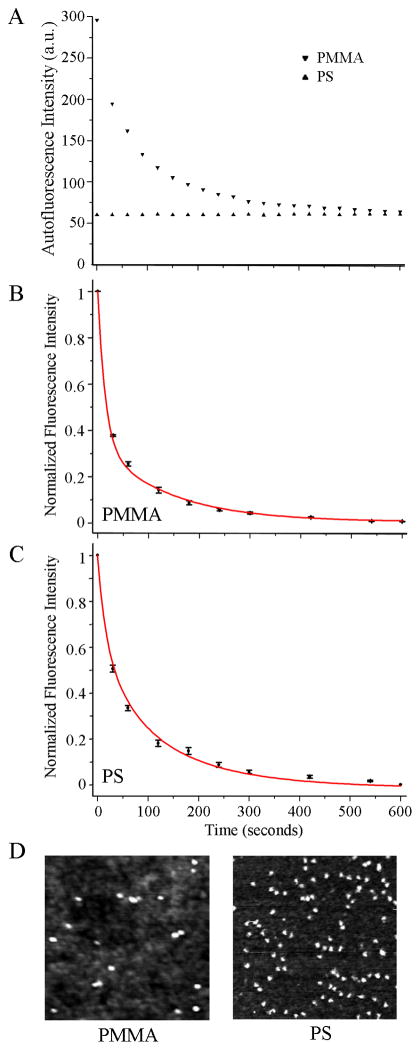
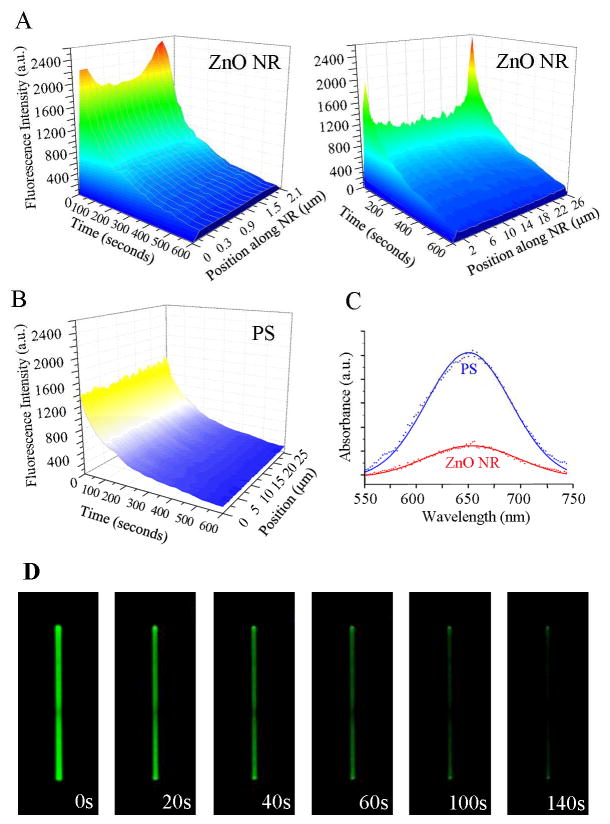
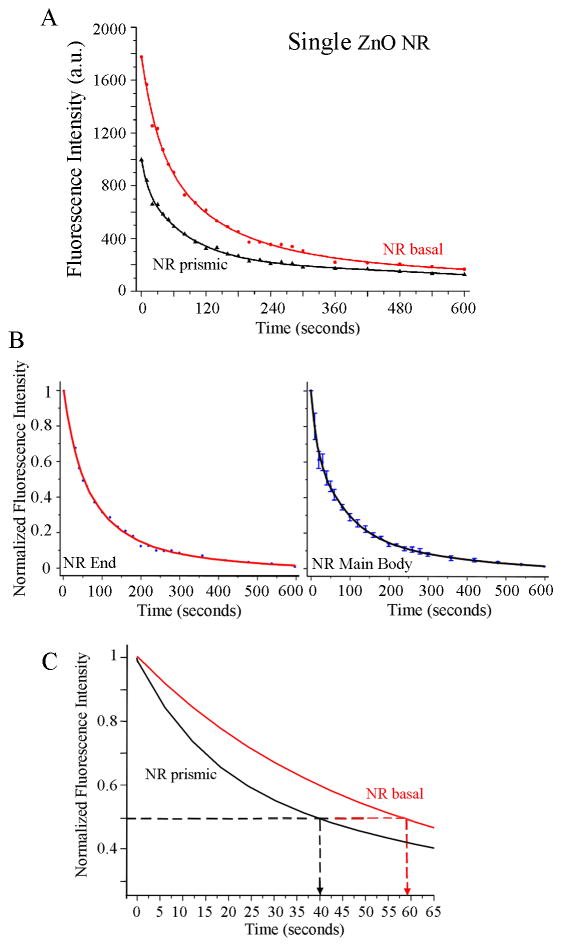
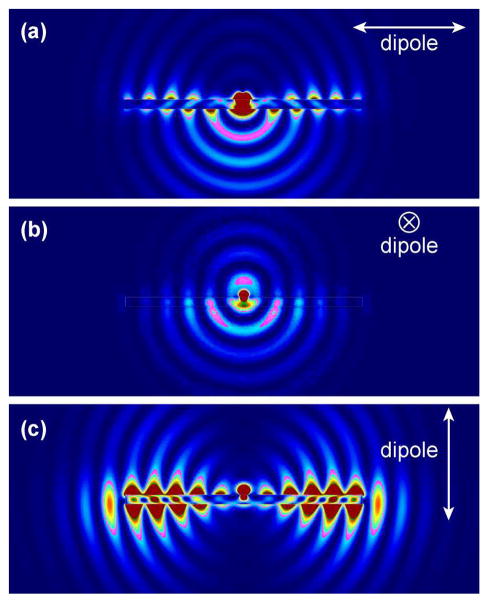
Zinc oxide nanorods (ZnO NRs) have emerged in recent years as extremely useful, optical signal-enhancing platforms in DNA and protein detection. Although the use of ZnO NRs in biodetection has been demonstrated so far in systems involving many ZnO NRs per detection element, their future applications will likely take place in a miniaturized setting while exploiting single ZnO NRs in a low-volume, high-throughput bioanalysis. In this paper, we investigate temporal and spatial characteristics of the biomolecular fluorescence on individual ZnO NR systems. Quantitative and qualitative examinations of the biomolecular intensity and photostability are carried out as a function of two important criteria, the time and position along the long axis (length) of NRs. Photostability profiles are also measured with respect to the position on NRs and compared to those characteristics of biomolecules on polymeric control platforms. Unlike the uniformly distributed signal observed on the control platforms, both the fluorescence intensity and photostability are position-dependent on individual ZnO NRs. We have identified a unique phenomenon of highly localized, fluorescence intensification on the nanorod ends (FINE) of well-characterized, individual ZnO nanostructures. When compared to the polymeric controls, the biomolecular fluorescence intensity and photostability are determined to be higher on individual ZnO NRs regardless of the position on NRs. We have also carried out finite-difference time-domain simulations the results of which are in good agreement with the observed FINE. The outcomes of our investigation will offer a much needed basis for signal interpretation for biodetection devices and platforms consisting of single ZnO NRs and, at the same time, contribute significantly to provide insight in understanding the biomolecular fluorescence observed from ZnO NR ensemble-based systems.
Figures
Similar articles
-
Polarization-resolved mechanistic investigation of fluorescence signal intensification on zinc oxide nanorod ends.Nanoscale. 2017 Jun 22;9(24):8164-8175. doi: 10.1039/c7nr02201h. Nanoscale. 2017. PMID: 28580980 Free PMC article.
-
Principles and Applications of ZnO Nanomaterials in Optical Biosensors and ZnO Nanomaterial-Enhanced Biodetection.Biosensors (Basel). 2024 Oct 6;14(10):480. doi: 10.3390/bios14100480. Biosensors (Basel). 2024. PMID: 39451693 Free PMC article. Review.
-
Insight into factors affecting the presence, degree, and temporal stability of fluorescence intensification on ZnO nanorod ends.Nanoscale. 2015 Jan 28;7(4):1424-36. doi: 10.1039/c4nr06066k. Nanoscale. 2015. PMID: 25504319 Free PMC article.
-
Effects of crystallographic facet-specific peptide adsorption along single ZnO nanorods on the characteristic fluorescence intensification on nanorod ends (FINE) phenomenon.Nanoscale. 2015 Nov 28;7(44):18813-26. doi: 10.1039/c5nr05354d. Epub 2015 Oct 28. Nanoscale. 2015. PMID: 26509316 Free PMC article.
-
Zinc oxide nanomaterials for biomedical fluorescence detection.J Nanosci Nanotechnol. 2014 Jan;14(1):475-86. doi: 10.1166/jnn.2014.9099. J Nanosci Nanotechnol. 2014. PMID: 24730276 Free PMC article. Review.
Cited by
-
Scattering attributes of one-dimensional semiconducting oxide nanomaterials individually probed for varying light-matter interaction angles.Appl Phys Lett. 2015 Oct 12;107(15):151110. doi: 10.1063/1.4933400. Epub 2015 Oct 15. Appl Phys Lett. 2015. PMID: 26549887 Free PMC article.
-
Elucidation of Strain-Dependent, Zinc Oxide Nanorod Response for Nanorod-Guided Fluorescence Intensity.Nanomaterials (Basel). 2022 Oct 11;12(20):3558. doi: 10.3390/nano12203558. Nanomaterials (Basel). 2022. PMID: 36296748 Free PMC article.
-
Polarization-resolved mechanistic investigation of fluorescence signal intensification on zinc oxide nanorod ends.Nanoscale. 2017 Jun 22;9(24):8164-8175. doi: 10.1039/c7nr02201h. Nanoscale. 2017. PMID: 28580980 Free PMC article.
-
Ultratrace level determination and quantitative analysis of kidney injury biomarkers in patient samples attained by zinc oxide nanorods.Nanoscale. 2016 Feb 28;8(8):4613-22. doi: 10.1039/c5nr08706f. Nanoscale. 2016. PMID: 26846189 Free PMC article.
-
Principles and Applications of ZnO Nanomaterials in Optical Biosensors and ZnO Nanomaterial-Enhanced Biodetection.Biosensors (Basel). 2024 Oct 6;14(10):480. doi: 10.3390/bios14100480. Biosensors (Basel). 2024. PMID: 39451693 Free PMC article. Review.
References
-
- Dorfman A, Kumar N, Hahm J. Langmuir. 2006;22:4890–4895. - PubMed
-
- Dorfman A, Kumar N, Hahm J. Adv Mater. 2006;18:2685–2690.
-
- Dorfman A, Parajuli O, Kumar N, Hahm J. J Nanosci Nanotech. 2008;8:410–415. - PubMed
-
- Kumar N, Dorfman A, Hahm J. Nanotech. 2006;17:2875–2881.
-
- Adalsteinsson V, Parajuli O, Kepics S, Gupta A, Reeves WB, Hahm J. Anal Chem. 2008;80:6594–6601. - PubMed
Publication types
Grants and funding
LinkOut - more resources
Full Text Sources
Other Literature Sources