. 2014 Feb;63(2):632-44.
doi: 10.2337/db13-0981. Epub 2013 Nov 5.

pH of drinking water influences the composition of gut microbiome and type 1 diabetes incidence

Affiliations

pH of drinking water influences the composition of gut microbiome and type 1 diabetes incidence

M Hanief Sofi et al. Diabetes. 2014 Feb.

Abstract

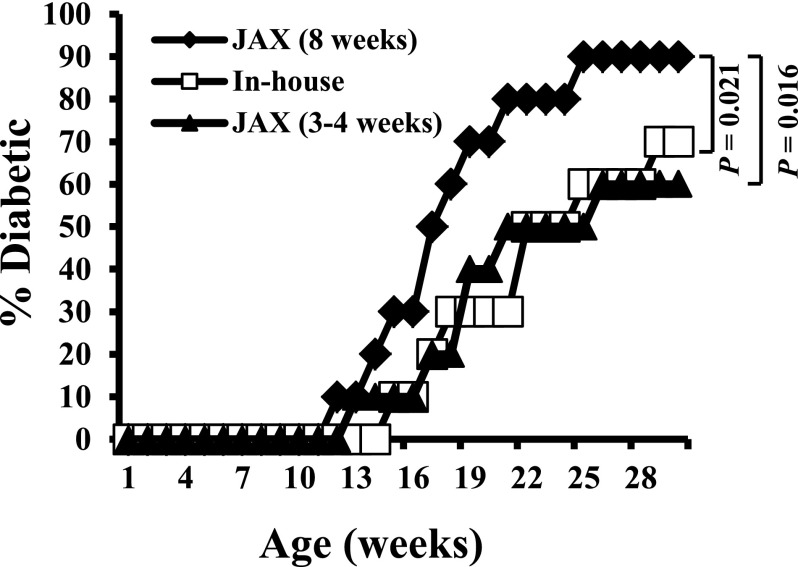
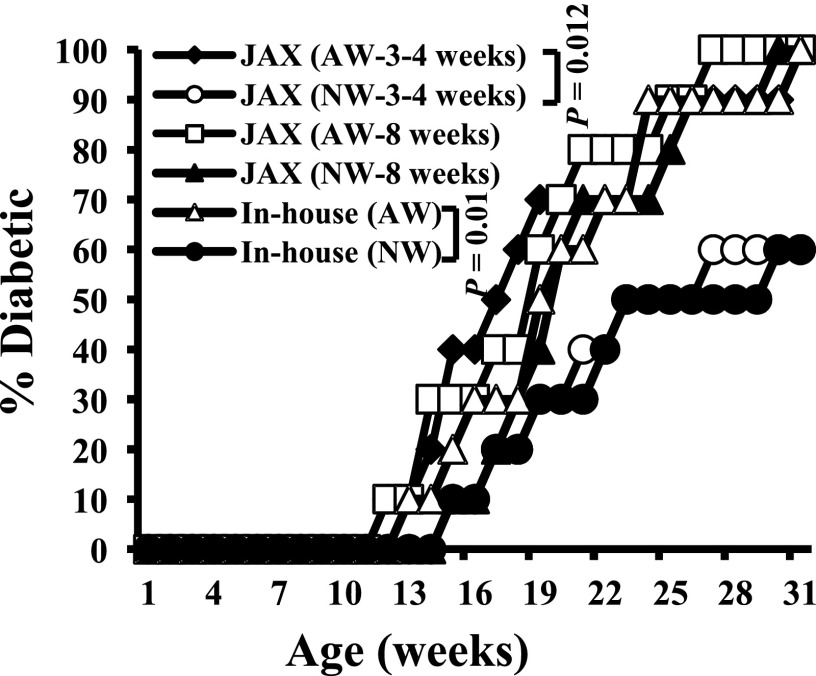
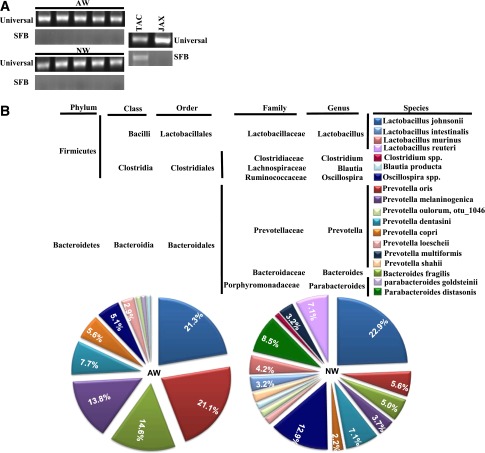
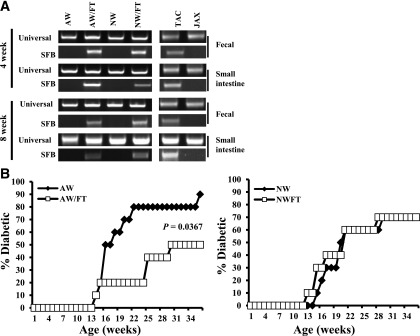
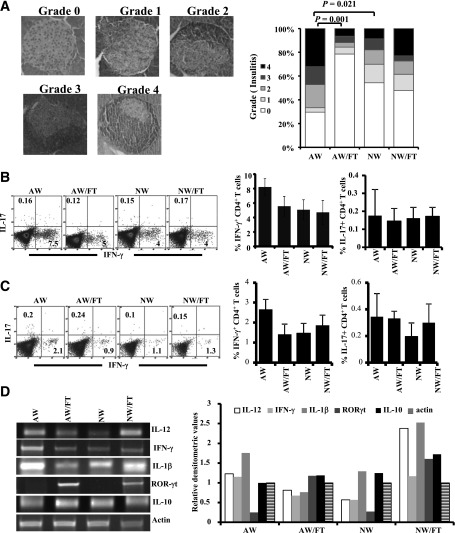
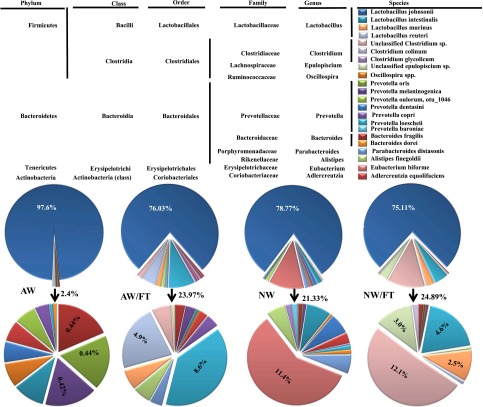
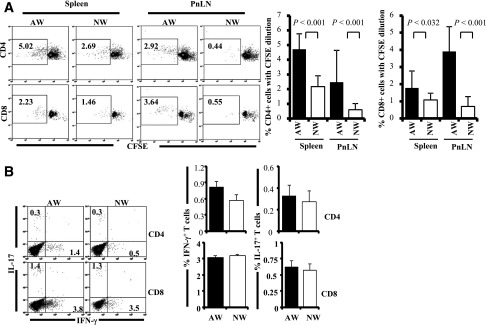
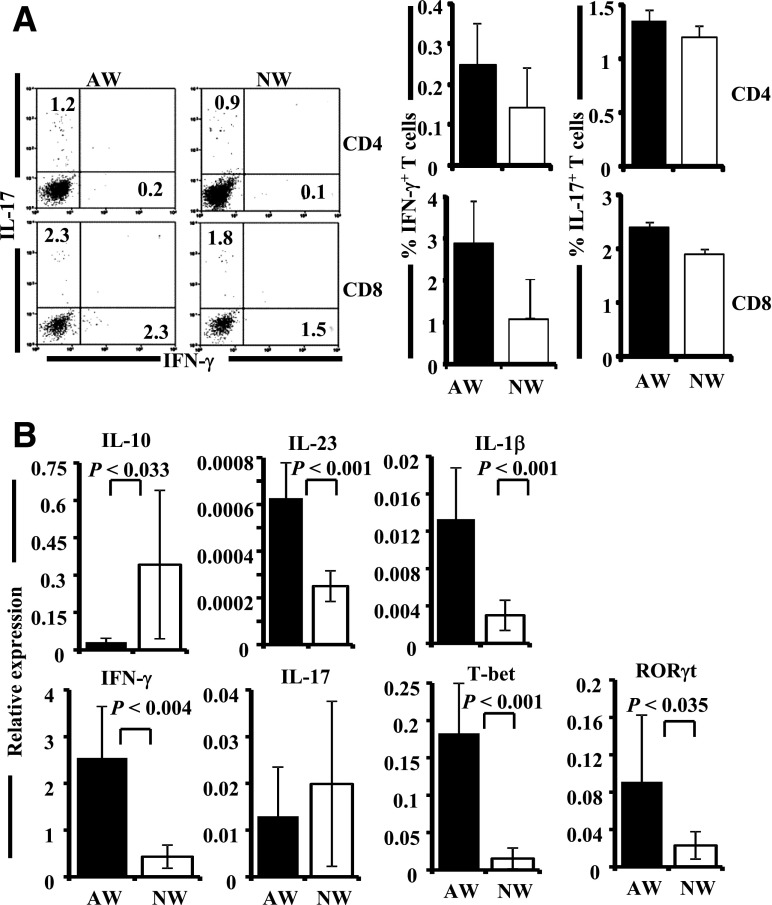
Nonobese diabetic (NOD) mice spontaneously develop type 1 diabetes (T1D), progression of which is similar to that in humans, and therefore are widely used as a model for understanding the immunological basis of this disease. The incidence of T1D in NOD mice is influenced by the degree of cleanliness of the mouse colony and the gut microflora. In this report, we show that the T1D incidence and rate of disease progression are profoundly influenced by the pH of drinking water, which also affects the composition and diversity of commensal bacteria in the gut. Female NOD mice that were maintained on acidic pH water (AW) developed insulitis and hyperglycemia rapidly compared with those on neutral pH water (NW). Interestingly, forced dysbiosis by segmented filamentous bacteria (SFB)-positive fecal transfer significantly suppressed the insulitis and T1D incidence in mice that were on AW but not in those on NW. The 16S rDNA-targeted pyrosequencing revealed a significant change in the composition and diversity of gut flora when the pH of drinking water was altered. Importantly, autoantigen-specific T-cell frequencies in the periphery and proinflammatory cytokine response in the intestinal mucosa are significantly higher in AW-recipient mice compared with their NW counterparts. These observations suggest that pH of drinking water affects the composition of gut microflora, leading to an altered autoimmune response and T1D incidence in NOD mice.


Figures

Figure 1
Figure 1
JAX NOD mice develop disease rapidly compared with their in-house counterparts. Female NOD/ShiLtJ mice were purchased from JAX at 3–4 weeks or prediabetic age (8 weeks) and maintained at our SPF facility (on NW as done traditionally; n = 10/group). These mice and female NOD mice from in-house SPF colony (NOD/ShiLtJ origin; 2nd generation) that were on NW water were examined for blood glucose levels every week starting at the age of week 9. Mice with glucose levels >250 mg/dL for two consecutive weeks were considered diabetic. An example of observations made in at least three different experiments using 10 mice/group is shown.
Figure 2
Figure 2
pH of drinking water affects the T1D incidence in NOD mice. Female NOD mice from in-house SPF colony (2nd- or 3rd-generation NOD/ShiLtJ mice) and 3- to 4- and 8-week-old mice purchased from JAX were maintained on either AW or NW and monitored for hyperglycemia (n = 10/group) as described for Fig. 1. While half the JAX mice were switched to NW or continued on AW upon arrival, in-house mice were on AW or NW starting at gestation stage.
Figure 3
Figure 3
Drinking-water pH–dependent effect in NOD mice is not due to SFB but may be due to the difference in gut microflora. A: DNA prepared from the fecal samples of 8-week-old female NOD mice from our SPF facility (5 representative cages each) was tested for 16S rDNA using universal or SFB-specific primers by qualitative PCR. Fecal samples from JAX and B6 mice cages of TAC were used as negative and positive control, respectively. B: DNA prepared from the fecal samples of female NOD mice that were on AW or switched to NW at 4 weeks of age, for 30 days (at 8 weeks of age), were subjected to 16S rDNA targeted pyrosequencing as described in research design and methods. The OTUs were taxonomically classified using BLAST against a curated Green Genes database. The most relevant taxonomic levels of specific communities, based upon the percentage identity to reference sequences, were determined. The mean percentage values of bacterial sequences that were identified to species or phylum levels are shown. Communities that showed >1% of total flora are shown. Percentage values of communities that showed >2% of total flora are indicated on the chart.
Figure 4
Figure 4
Dysbiosis induced by FT delays T1D in NOD mice that were on AW but not on NW. Female NOD mice were purchased from JAX at 3–4 weeks of age and continued on AW or switched to NW. Cages of one set of each group of mice were transplanted with fecal pellets (FT groups) of SFB+ C57BL/6 mice from TAC as described in research design and methods. A: Sets of three mice from each group were killed at 4 and 8 weeks post–drinking-water switch and FT (8 and 12 weeks of age), DNA was prepared from the distal ileum, and fecal pellets were tested for 16S rDNA using universal or SFB-specific primers by qualitative PCR (results obtained using representative samples are shown). Fecal samples from JAX and B6 mouse cages of TAC were used as negative and positive control, respectively. B: Sets of 10 mice/group were monitored for hyperglycemia as described for Fig. 1. Results of AW and NW groups are plotted against the results of their FT recipients and shown separately.
Figure 5
Figure 5
NOD mice on AW show severe insulitis and difference in the gut immune response compared with SFB+ FT and NW recipients. Female NOD mice were purchased from JAX at 3–4 weeks of age and continued on AW or switched to NW and subjected to FT as described for Fig. 4. Sets of three mice from each group were killed at 4 weeks post–drinking-water switch and FT (8 weeks of age) for histopathological and immunological analyses. A: Pancreatic tissues were sectioned and stained using H-E and examined for immune cell infiltration in the islets, and insulitis was scored based on the extent of infiltration. Representative images showing different insulitis grades (left panel) and bar diagrams on percentage of islets in each group with different grades of insulitis (right panel) are shown. At least 150 islets were examined for each group. Single-cell suspensions of spleen (B) and PP (C) were stimulated with phorbol myristic acid/ionomycin for 4 h and examined for intracellular cytokines in CD4+ T cells by FACS. Representative FACS analysis graphs with percentage values (left panels) and mean ± SD of percentage values of IFN-γ– and IL-17–positive cells (right panels) of three/group are shown in a bar diagram. This experiment was repeated once using a similar number of mice. D: cDNA were synthesized and used in a qualitative PCR assay to detect the expression levels of cytokines and transcription factors. This experiment was done twice using three mice/group, and gel profiles of representative samples (left panel) and mean densitometry values (right panel) are shown.
Figure 6
Figure 6
Drinking water pH affects the acquisition of microflora and leads to dysbiosis upon switching from AW to NW. Three- to four-week-old female NOD mice were purchased from JAX and continued on AW or switched to NW and subjected to FT as described for Fig. 5. These mice were killed at 8 weeks of age, and the DNA prepared from distal ileum samples was subjected to 16S rDNA–targeted pyrosequencing. The data were analyzed as described for Fig. 4, and the mean percentage values of bacterial sequences that were identified to species or phylum levels are shown. Upper pie charts represent all communities, and lower pie charts show communities other than Lactobacillus johnsonii. Percentage values of major non–L. johnsonii flora are shown.
Figure 7
Figure 7
AW-recipient mice show higher autoreactive/proinflammatory T cells in the pancreatic microenvironment compared with NW recipients. Four-week-old NOD mice were continued on AW or switched to NW for 4 weeks and killed at 8 weeks of age, and single suspensions from spleen and PnLN were used for immunological analysis. A: PnLN and spleen cells were labeled with CFSE, incubated with immunodominant β-cell antigen for 4 days, and examined for CFSE dilution among CD4+ and CD8+ cells by FACS. Representative FACS analysis graphs with percentage values (left panel) and mean ± SD of percentage of CD4 and CD8 cells with CFSE dilution (4 mice/group tested independently) (right panel) are shown. B: PnLN cells were also activated ex vivo with phorbol myristic acid and ionomycin in the presence of brefeldin A for 4 h and stained for surface CD4 and CD8, followed by intracellular IFN-γ and IL-17. Representative FACS analysis graphs with percentage values (left panel) and mean ± SD of percentage values of IFN-γ– and IL-17–positive cells among CD4 and CD8 populations from 4 mice/group tested independently (right panel) are shown.
Figure 8
Figure 8
AW-recipient mice show higher proinflammatory response in the gut mucosa. Four-week-old NOD mice were continued on AW or switched to NW for 4 weeks and killed at 8 weeks of age, and PP and intestinal tissues were used for immunological analysis. A: PP cells were activated ex vivo with phorbol myristic acid and ionomycin in the presence of brefeldin A for 4 h and stained for surface CD4 and CD8, followed by intracellular IFN-γ and IL-17 for FACS analysis. Representative FACS analysis graphs with percentage values (left panel) and mean ± SD of percentage values of IFN-γ– and IL-17–positive cells among CD4 and CD8 populations from 4 mice/group tested independently (right panel) are shown. B: cDNA prepared from the small intestine (distal ileum) was used in real-time quantitative PCR to examine the expression profiles of cytokines and transcription factors. Relative expression levels of these factors in each tissue were calculated against the expression level of a housekeeping gene (β-actin) of the same sample. Mean ± SD of values from 3 mice/group tested independently in triplicate is shown.

Comment in

References

    1. Rook GA. Hygiene hypothesis and autoimmune diseases. Clin Rev Allergy Immunol 2012;42:5–15 - PubMed
    1. Bach JF. Protective role of infections and vaccinations on autoimmune diseases. J Autoimmun 2001;16:347–353 - PubMed
    1. Germolec D, Kono DH, Pfau JC, Pollard KM. Animal models used to examine the role of the environment in the development of autoimmune disease: findings from an NIEHS Expert Panel Workshop. J Autoimmun 2012;39:285–293 - PMC - PubMed
    1. Christen U, Bender C, von Herrath MG. Infection as a cause of type 1 diabetes? Curr Opin Rheumatol 2012;24:417–423 - PMC - PubMed
    1. Pozzilli P, Signore A, Williams AJ, Beales PE. NOD mouse colonies around the world—recent facts and figures. Immunol Today 1993;14:193–196 - PubMed

Publication types