. 2013 Nov 19;110(47):E4502-9.
doi: 10.1073/pnas.1317918110. Epub 2013 Nov 5.

Regional variability of imaging biomarkers in autosomal dominant Alzheimer's disease

Affiliations

Regional variability of imaging biomarkers in autosomal dominant Alzheimer's disease

Tammie L S Benzinger et al. Proc Natl Acad Sci U S A. .

Abstract

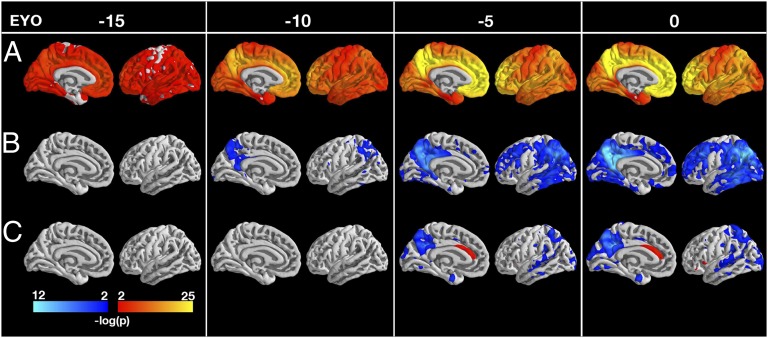
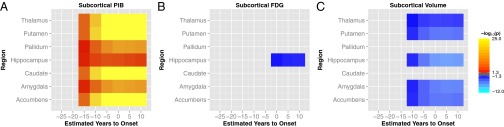
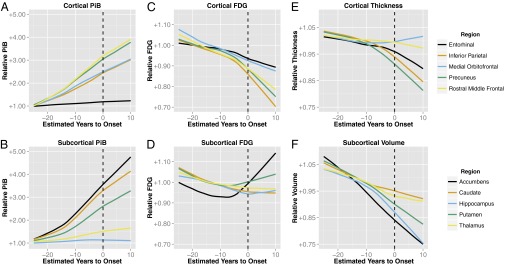
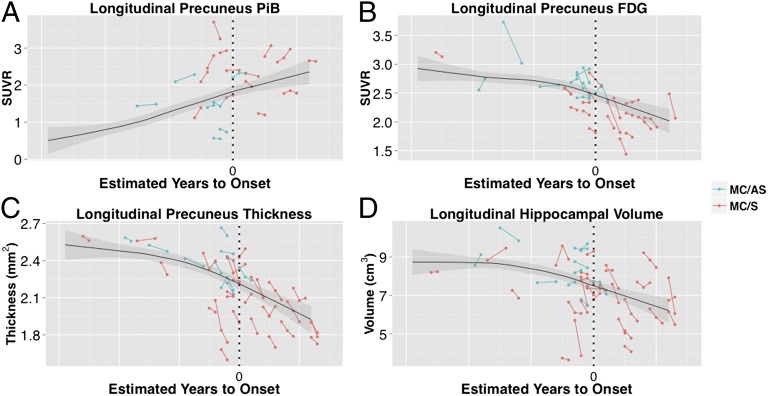
Major imaging biomarkers of Alzheimer's disease include amyloid deposition [imaged with [(11)C]Pittsburgh compound B (PiB) PET], altered glucose metabolism (imaged with [(18)F]fluro-deoxyglucose PET), and structural atrophy (imaged by MRI). Recently we published the initial subset of imaging findings for specific regions in a cohort of individuals with autosomal dominant Alzheimer's disease. We now extend this work to include a larger cohort, whole-brain analyses integrating all three imaging modalities, and longitudinal data to examine regional differences in imaging biomarker dynamics. The anatomical distribution of imaging biomarkers is described in relation to estimated years from symptom onset. Autosomal dominant Alzheimer's disease mutation carrier individuals have elevated PiB levels in nearly every cortical region 15 y before the estimated age of onset. Reduced cortical glucose metabolism and cortical thinning in the medial and lateral parietal lobe appeared 10 and 5 y, respectively, before estimated age of onset. Importantly, however, a divergent pattern was observed subcortically. All subcortical gray-matter regions exhibited elevated PiB uptake, but despite this, only the hippocampus showed reduced glucose metabolism. Similarly, atrophy was not observed in the caudate and pallidum despite marked amyloid accumulation. Finally, before hypometabolism, a hypermetabolic phase was identified for some cortical regions, including the precuneus and posterior cingulate. Additional analyses of individuals in which longitudinal data were available suggested that an accelerated appearance of volumetric declines approximately coincides with the onset of the symptomatic phase of the disease.

Keywords: DIAN; aging; dementia; neurodegeneration; neuroimaging.


Conflict of interest statement

The authors declare no conflict of interest.

Figures

Fig. 1.
Fig. 1.
Statistical significance (P value) maps on medial and lateral left cortical gray surface showing differences between carriers and noncarriers in PiB (A), FDG (B), and cortical thickness (C) at −15, −10, −5, and 0 y before predicted symptom onset. Regions with significant (P < 0.01 after correction for multiple comparisons) increases are shown in red/yellow and decreases in blue/cyan. The medial wall was not analyzed. Significant increases in amyloid PiB PET were detected at least 15 y before the estimated age of symptom onset in across the cerebral cortex. Decreased glucose metabolism was detected 10 y before predicted symptom onset using FDG PET, primarly involving the precuenus, posterior cingulate, and lateral parietal lobes. Cortical thinning on MRI was detected ∼5 y before the estimated onset of symptoms, initially in the precuneus and posterior cingulate as well as portions of the occipital lobe and anterior temporal lobe. Results were consistent for both hemispheres for all modalities.
Fig. 2.
Fig. 2.
Comparison of [11C]Pittsburgh compound B (PiB) (A), FDG (B), and volume (C) between carriers and noncarriers in subcortical gray matter. Significant increases (FDR corrected P < 0.05) are indicated in red/orange and decreases in blue/cyan. Elevated PiB uptake was detected by EYO = −15 in all of the subcortical gray matter structures. Excluding the pallidum and caudate, all subcortical structures exhibited volumetric decline ten years before the expected age of onset. Metabolic decreases were only seen in the hippocampus, and only after the estimated onset of symptoms.
Fig. 3.
Fig. 3.
Biomarker trajectories for PiB (A and B), FDG (C and D), cortical thickness (E), and subcortical volume (F) estimated with cross-sectional first-degree LOESS curves in mutation carriers. To account for baseline differences between regions, carrier data were first divided by the mean of noncarriers for that region. Trajectories for five cortical gray matter regions (entorhinal, inferior parietal, medial orbitofrontal, precuneus, and rostral middle frontal) are shown in the top row (A, C, and E). The bottom row (B, D, and F) shows curves for five subcortical gray matter regions (accumbens, caudate, hippocampus, putamen, and thalamus).
Fig. 4.
Fig. 4.
Longitudinal data for PiB (A), FDG (B), cortical thickness (C), and hippocampal volume (D). Asymptomatic (CDR 0) participants are shown in blue. Symptomatic participants (CDR 0.5 or higher) are shown in red. Overlaid on each plot is the LOESS estimated cross-sectional trajectory for carriers with 95% confidence intervals of the mean in gray. Note the generally steeper longitudinal vs. cross-sectional slope in symptomatic participants. The x axis is unlabeled and only carriers are shown to protect the mutation status of each participant.

References

    1. Goedert M, Spillantini MG. A century of Alzheimer’s disease. Science. 2006;314(5800):777–781. - PubMed
    1. Hardy JA, Higgins GA. Alzheimer’s disease: The amyloid cascade hypothesis. Science. 1992;256(5054):184–185. - PubMed
    1. Jack CR, Jr, et al. Hypothetical model of dynamic biomarkers of the Alzheimer’s pathological cascade. Lancet Neurol. 2010;9(1):119–128. - PMC - PubMed
    1. Campion D, et al. Early-onset autosomal dominant Alzheimer disease: Prevalence, genetic heterogeneity, and mutation spectrum. Am J Hum Genet. 1999;65(3):664–670. - PMC - PubMed
    1. Fox NC, et al. Clinicopathological features of familial Alzheimer’s disease associated with the M139V mutation in the presenilin 1 gene. Pedigree but not mutation specific age at onset provides evidence for a further genetic factor. Brain. 1997;120(Pt 3):491–501. - PubMed

Publication types

MeSH terms