. 2013 Oct 29:7:34.
doi: 10.3389/fnana.2013.00034. eCollection 2013.

The hippocampus of the eastern rock sengi: cytoarchitecture, markers of neuronal function, principal cell numbers, and adult neurogenesis

Affiliations

The hippocampus of the eastern rock sengi: cytoarchitecture, markers of neuronal function, principal cell numbers, and adult neurogenesis

Lutz Slomianka et al. Front Neuroanat. .

Abstract

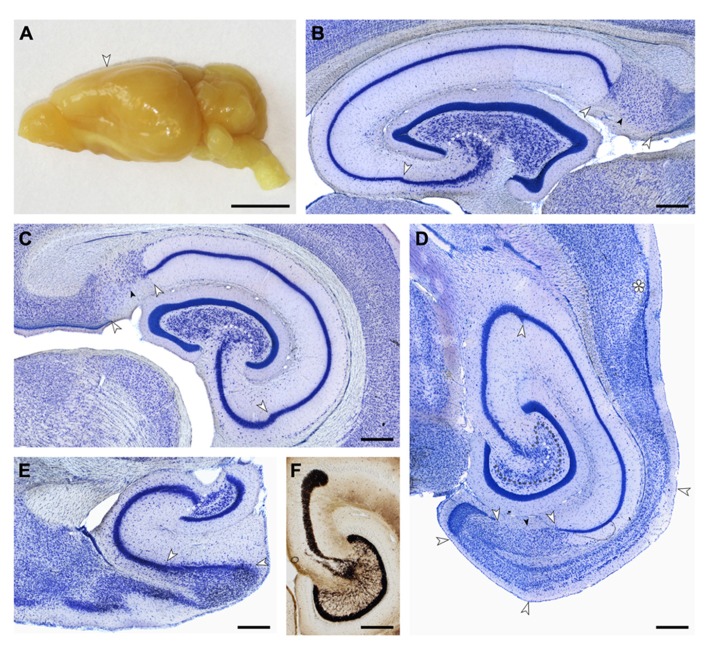
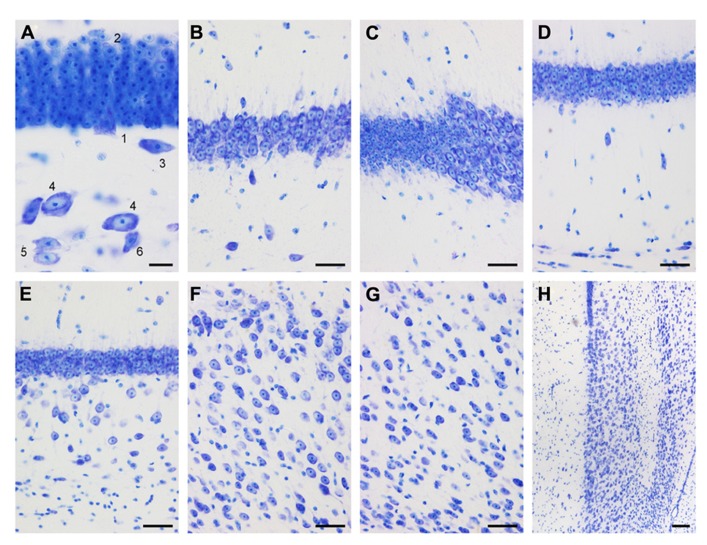
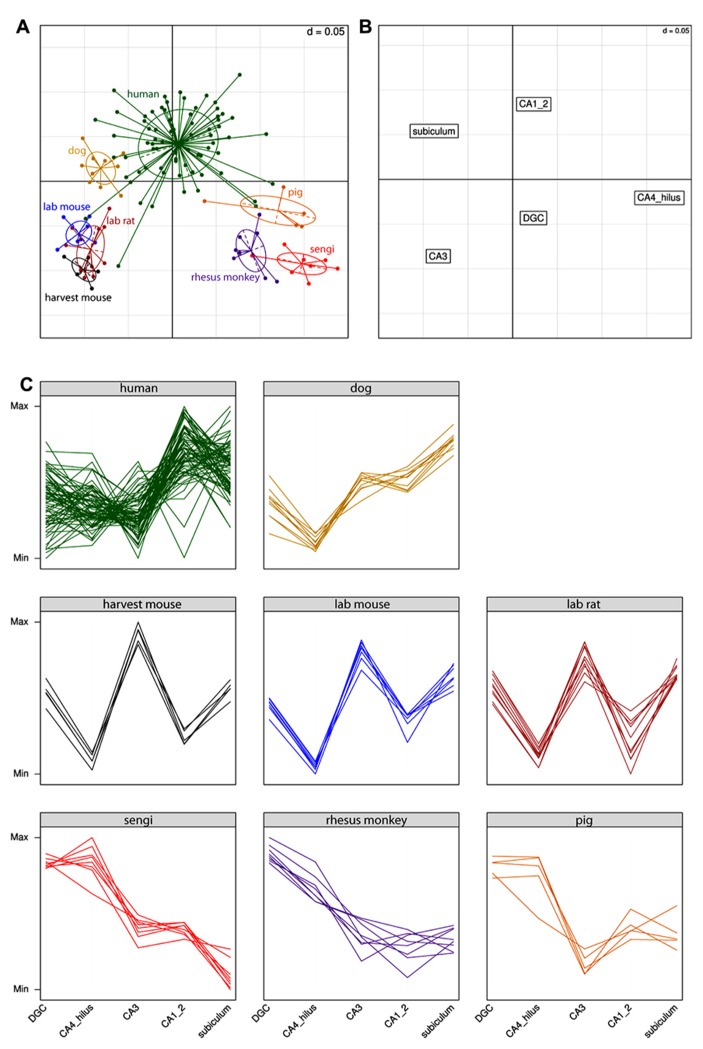
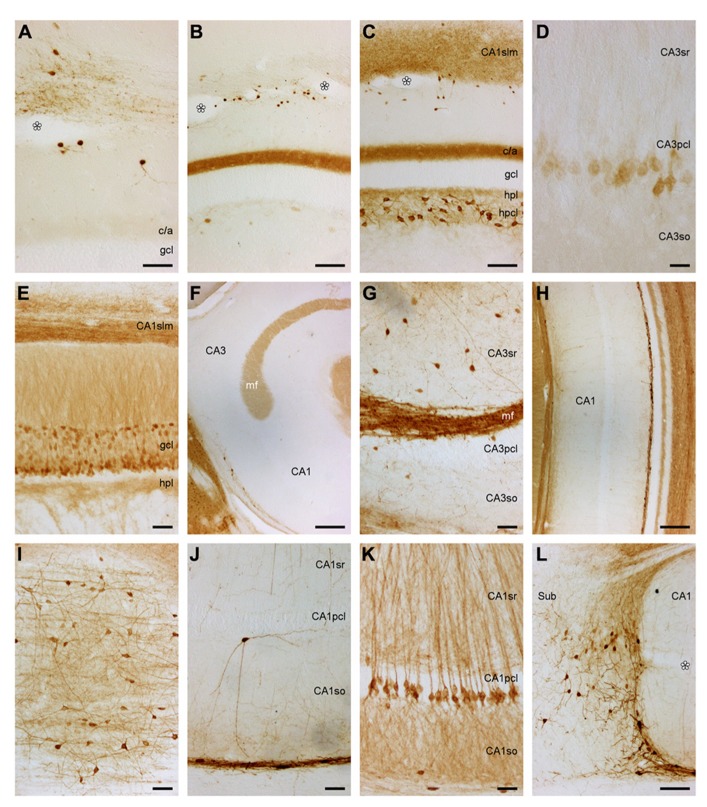
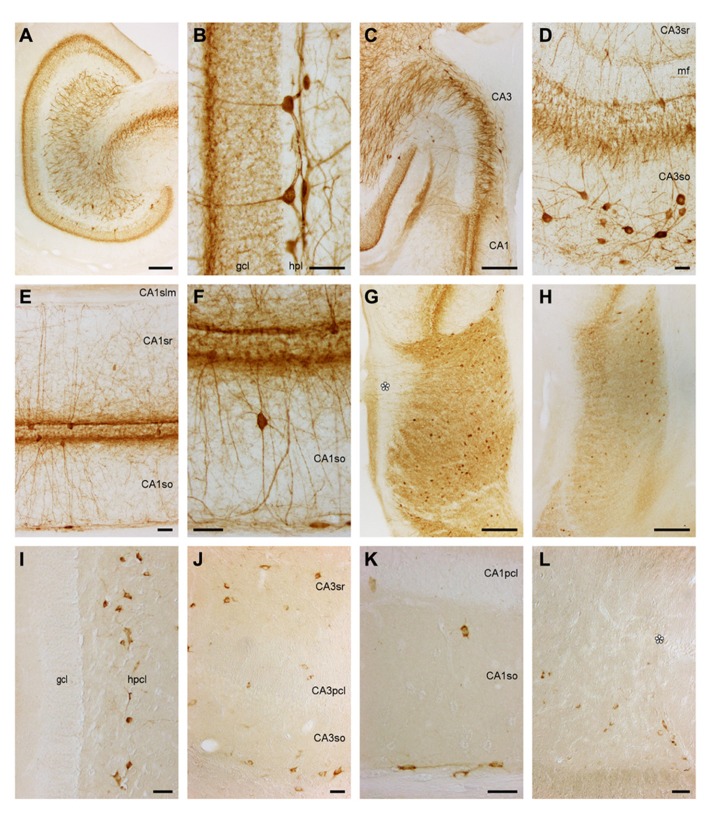
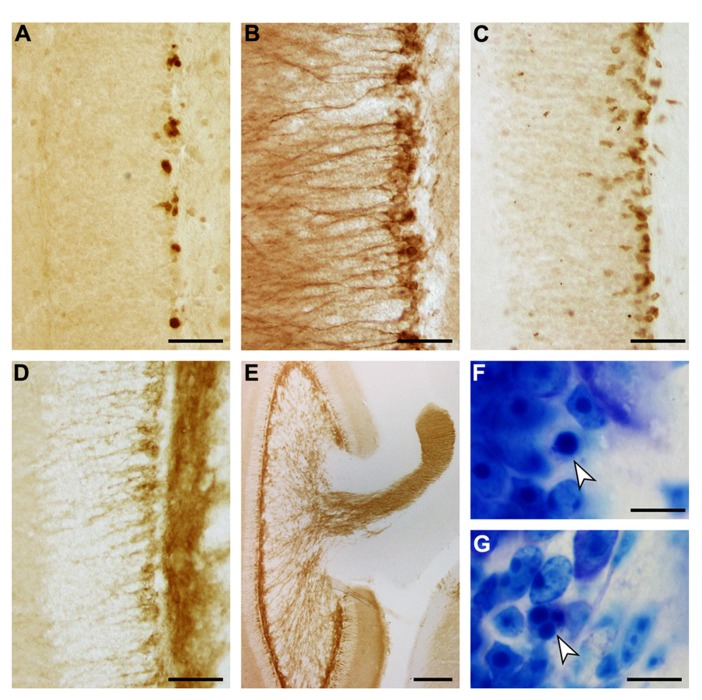
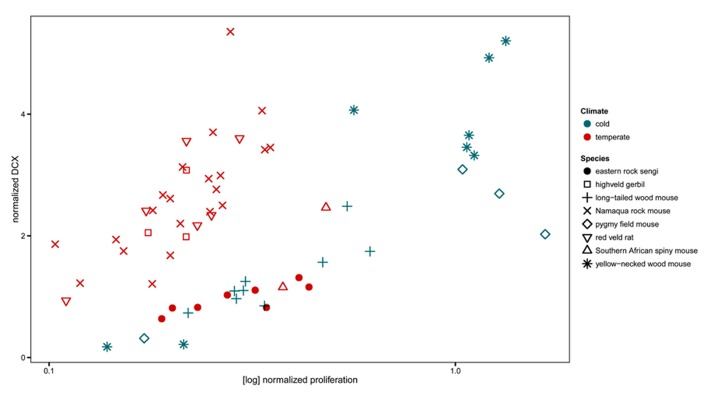
The brains of sengis (elephant shrews, order Macroscelidae) have long been known to contain a hippocampus that in terms of allometric progression indices is larger than that of most primates and equal in size to that of humans. In this report, we provide descriptions of hippocampal cytoarchitecture in the eastern rock sengi (Elephantulus myurus), of the distributions of hippocampal calretinin, calbindin, parvalbumin, and somatostatin, of principal neuron numbers, and of cell numbers related to proliferation and neuronal differentiation in adult hippocampal neurogenesis. Sengi hippocampal cytoarchitecture is an amalgamation of characters that are found in CA1 of, e.g., guinea pig and rabbits and in CA3 and dentate gyrus of primates. Correspondence analysis of total cell numbers and quantitative relations between principal cell populations relate this sengi to macaque monkeys and domestic pigs, and distinguish the sengi from distinct patterns of relations found in humans, dogs, and murine rodents. Calretinin and calbindin are present in some cell populations that also express these proteins in other species, e.g., interneurons at the stratum oriens/alveus border or temporal hilar mossy cells, but neurons expressing these markers are often scarce or absent in other layers. The distributions of parvalbumin and somatostatin resemble those in other species. Normalized numbers of PCNA+ proliferating cells and doublecortin-positive (DCX+) differentiating cells of neuronal lineage fall within the overall ranges of murid rodents, but differed from three murid species captured in the same habitat in that fewer DCX+ cells relative to PCNA+ were observed. The large and well-differentiated sengi hippocampus is not accompanied by correspondingly sized cortical and subcortical limbic areas that are the main hippocampal sources of afferents and targets of efferents. This points to intrinsic hippocampal information processing as the selective advantage of the large sengi hippocampus.

Keywords: Macroscelididae; calcium-binding proteins; comparative neuroanatomy; correspondence analysis; dentate gyrus; neuronal differentiation; proliferation; somatostatin.


Figures

FIGURE 1
FIGURE 1
The eastern rock sengi, Elephantulus myurus (courtesy of Heike Lautermann, Department of Zoology, University of Pretoria, South Africa).
FIGURE 2
FIGURE 2
(A) Macroscopic lateral view of the eastern rock sengi brain. The posterior expansion of the hemisphere largely reflects the shape of the underlying hippocampus. Scale bar: 5 mm. (B–E) Light arrows and light dotted line mark the borders between hippocampal fields. Small dark arrows mark the border between the proximal and distal parts of the subiculum. (B,C,E) 40 μm-thick frozen sections; (D,F) 20 μm-thick plastic embedded section. Scale bars in (B–F) 0.5 mm. (B) Sagittal section of the septal hippocampus located at the transition from the first to the second hippocampal quarter. (C) Frontal section of the hippocampus located midway along the septotemporal hippocampal axis. (D) Horizontal section of the temporal hippocampus located at the transition from the third to the fourth hippocampal quarter. The dark dotted line marks the tentative border between the reflected blade of CA3 and the mossy cell layer. Asterisk: sectioning artifact. (E) Sagittal section of the temporal pole of the hippocampus. The plane of section corresponds to (B). (F) Timm-stained section corresponding to (D) showing a dense, narrow band of staining below the granule cell layer from which individual strands extend to coalesce into the CA3 mossy fiber zone. At the distal end of CA3, mossy fibers form a distinct end-bulb.
FIGURE 3
FIGURE 3
Mid-septotemporal (unless noted otherwise) dentate gyrus and hippocampus in plastic embedded 20 μm-thick horizontal sections. (A) Composite of two focal planes of the dentate gyrus granule cell layer, hilar plexiform layer (hpl), and hilar polymorphic cell layer (hpcl). Cell 3 was cloned into this image from an adjacent field of view. 1, pyramidal (basket) cell; 2, large granule cell; 3, spindle-shaped cell of the hpl; 4; large polygonal neurons; 5, ovoid neurons, the dominant population of the hpcl; 6, small dark triangular cell. (B) CA3. (C) Transition from CA3 to CA1. (D) Composite of two focal planes of the CA1 pyramidal cell layer (CA1pcl), stratum oriens (CA1so), and stratum oriens/alveus border (so/a). (E) Temporal CA1pcl. (F) Proximal subicular cell layer (Scl). (G) Distal Scl. (H) Temporal subiculum. Scale bars: (A) 20 μm; (B–G) 50 μm; (H), 100 μm.
FIGURE 4
FIGURE 4
Correspondence analysis (A,B) and species profile (C) plots show the relationships between cell counts and hippocampal fields. Species form distinct clusters (A) with phylogenetically similar species such as the rodents clustering close together. The spatial arrangement of hippocampal fields in (B) can be used to determine which fields are driving the species clusters. For example, the rodents are located in the bottom left quadrant in (A), as is the CA3 region in (B). This means that rodents have relatively high numbers of cells in the CA3 (and relatively few cells in the CA4/hilus). These relationships can also be seen in the species profile plots (C), where each line represents an individual animal. The y-axes range from the minimum to the maximum value for each hippocampal field, and therefore the most relevant comparisons are across species for a given field (e.g., it can be determined that rodents have relatively more cells in the CA3 than humans). Note that it is not possible to determine from these graphs whether mice have a greater number of cells in the CA3 or dentate gyrus (DGC), as each field uses a different scale.
FIGURE 5
FIGURE 5
Calretinin and Calbindin in the eastern rock sengi dentate gyrus, hippocampus, and subiculum. (A–D) Calretinin. Asterisks: vessels in the obliterated hippocampal fissure. Scale bars: (A) 50 μm; (B,C) 100 μm; (D) 25 μm. (A) Septal dentate gyrus and border between CA1 stratum lacunosum moleculare (slm) and subicular plexiform layer. (B) Mid-septotemporal dentate gyrus and CA1slm. (C) Temporal dentate gyrus and CA1slm. (D) Calretinin+ cells in the deep pyramidal cell layer of temporal CA3. (E–L) Calbindin. Scale bars: (E,G,I–L) 50 μm; (F,H) 250 μm. (E) Heterogeneous distribution of calbindin in dentate granule cells. (F) calbindin+ cells are near absent in septal CA3. (G) Temporal CA3 (H) dense band of calbindin+ cells and processes at the stratum oriens/alveus border, but immunoreactive cells are otherwise near absent in CA1. (I) CA1, tangential section of stratum oriens/alveus border (J) Rare calbindin+ neuron deep to the CA1 pyramidal cell layer and fine plexus of fibers in the deep stratum oriens. (K) Calbindin+ deep pyramidal cells in temporal CA1. (L) CA1/subiculum border.
FIGURE 6
FIGURE 6
Parvalbumin and Somatostatin in the eastern rock sengi dentate gyrus, hippocampus and subiculum. (A–H) Parvalbumin. Scale bars: (A,C,G,H) 250 μm; (B,D–F) 50 μm (A) Mid-septotemporal dentate gyrus. (B) Septal granule cell and hilar plexiform layers. (C) Septal CA3. (D) Mid-septotemporal CA3 containing unusually many parvalbumin+ cells that reflect their morphological heterogeneity. (E,F) Mid-septotemporal CA1. (G) Septal subiculum. Beaded dendrites reach the pial surface in the proximal subiculum only (asterisk). (H) Temporal subiculum. (I–L) Somatostatin. Scale bars: (I,J) 50 μm (I) Dentate gyrus. Immunoreactive cells are only found in the hilar polymorphic cell layer. (J) CA3. (K) CA1. (L) Proximal subiculum (asterisk marks the end of the CA1 pyramidal cell layer).
FIGURE 7
FIGURE 7
Adult hippocampal neurogenesis in the eastern rock sengi dentate gyrus. Images were taken in the septal hippocampus corresponding to Figure 2B. (A) PCNA+ cells. (B) DCX+ cells. (C) NeuroD+ cells. (D) PSA-NCAM+ cells and neuropil. (E) PSA-NCAM+ cells and mossy fiber terminal fields. (F,G) Pyknotic cells (arrows). Scale bars: (A–D) 50 μm; (E) 250 μm; (F,G) 10 μm.
FIGURE 8
FIGURE 8
Neurogenesis in the eastern rock sengi in comparison to southern African rodents from the same temperate climate, compared with neurogenesis in four murids from a northern cold climate (adapted from Cavegn et al., 2013.) Neurogenesis data of sengis and spiny mice, both precocial species with exceptionally high numbers of granule cells, cluster with the species from the cold climate. For species comparisons, the numbers of proliferating cells (PCNA+ or Ki67+) and young cells of the neuronal lineage (DCX+) were normalized to total granule cell number.

References

    1. Abraham H., Meyer G. (2003). Reelin-expressing neurons in the postnatal and adult human hippocampal formation. Hippocampus 13 715–727 10.1002/hipo.10125 - DOI - PubMed
    1. Amaral D. G. (1978). A Golgi study of cell types in the hilar region of the hippocampus in the rat. J. Comp. Neurol. 182 851–914 10.1002/cne.901820508 - DOI - PubMed
    1. Amrein I., Isler K., Lipp H.-P. (2011). Comparing adult hippocampal neurogenesis in mammalian species and orders: influence of chronological age and life history stage. Eur. J. Neurosci. 34 978–987 10.1111/j.1460-9568.2011.07804.x - DOI - PubMed
    1. Amrein I., Slomianka L. (2010). A morphologically distinct granule cell type in the dentate gyrus of the red fox correlates with adult hippocampal neurogenesis. Brain Res. 1328 12–24 10.1016/j.brainres.2010.02.075 - DOI - PubMed
    1. Amrein I., Slomianka L., Lipp H.-P. (2004a). Granule cell number, cell death and cell proliferation in the dentate gyrus of wild-living rodents. Eur. J. Neurosci. 20 3342–3350 10.1111/j.1460-9568.2004.03795.x - DOI - PubMed

LinkOut - more resources