. 2013 Oct 29:7:710.
doi: 10.3389/fnhum.2013.00710. eCollection 2013.

High-Resolution MR Imaging of the Human Brainstem In vivo at 7 Tesla

Affiliations

High-Resolution MR Imaging of the Human Brainstem In vivo at 7 Tesla

Andreas Deistung et al. Front Hum Neurosci. .

Abstract

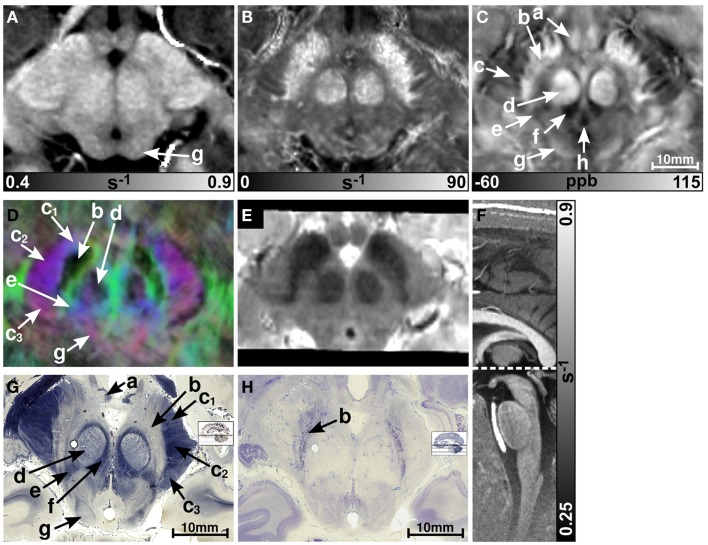
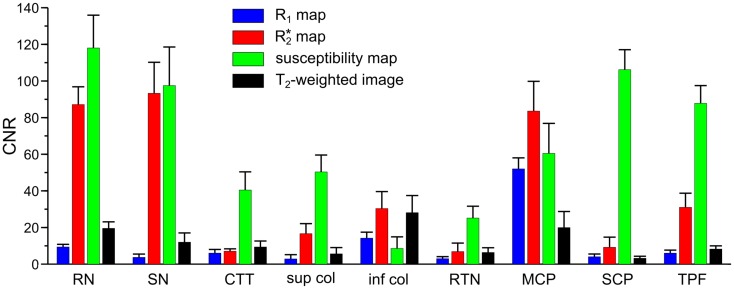
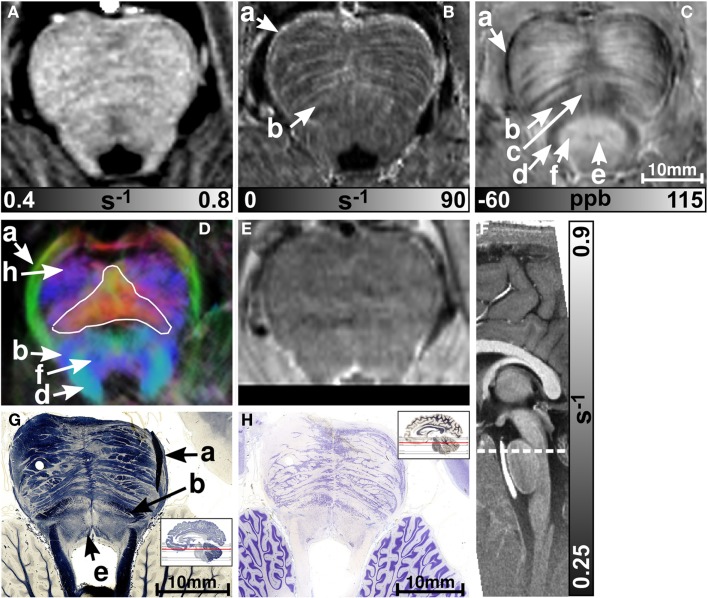
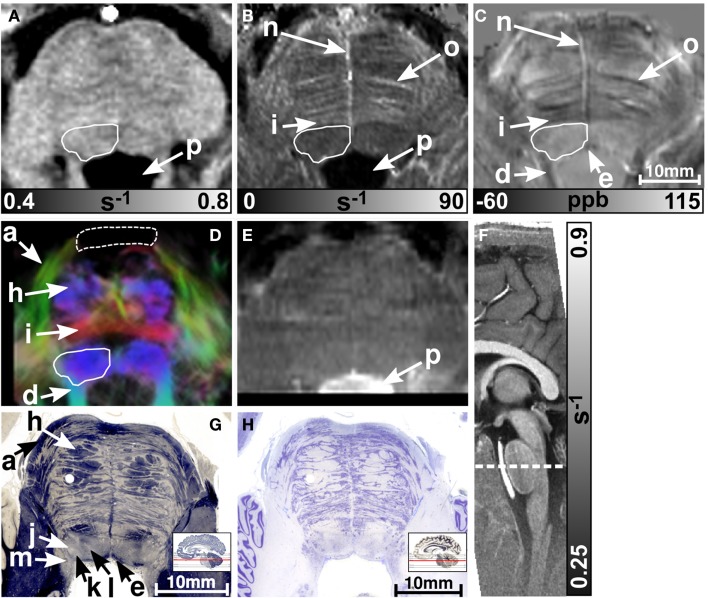
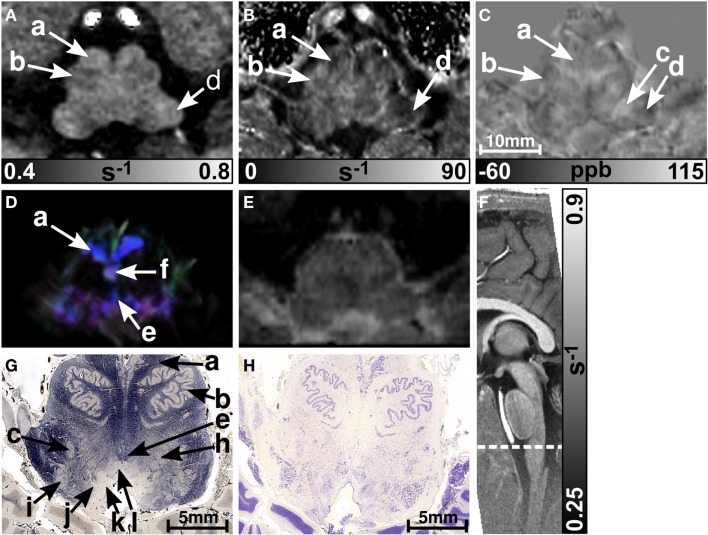
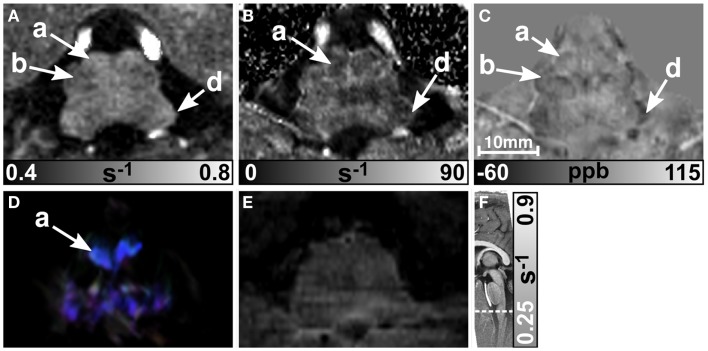
The human brainstem, which comprises a multitude of axonal nerve fibers and nuclei, plays an important functional role in the human brain. Depicting its anatomy non-invasively with high spatial resolution may thus in turn help to better relate normal and pathological anatomical variations to medical conditions as well as neurological and peripheral functions. We explored the potential of high-resolution magnetic resonance imaging (MRI) at 7 T for depicting the intricate anatomy of the human brainstem in vivo by acquiring and generating images with multiple contrasts: T 2-weighted images, quantitative maps of longitudinal relaxation rate (R 1 maps) and effective transverse relaxation rate ([Formula: see text] maps), magnetic susceptibility maps, and direction-encoded track-density images. Images and quantitative maps were compared with histological stains and anatomical atlases to identify nerve nuclei and nerve fibers. Among the investigated contrasts, susceptibility maps displayed the largest number of brainstem structures. Contrary to R 1 maps and T 2-weighted images, which showed rather homogeneous contrast, [Formula: see text] maps, magnetic susceptibility maps, and track-density images clearly displayed a multitude of smaller and larger fiber bundles. Several brainstem nuclei were identifiable in sections covering the pons and medulla oblongata, including the spinal trigeminal nucleus and the reticulotegmental nucleus on magnetic susceptibility maps as well as the inferior olive on R 1, [Formula: see text], and susceptibility maps. The substantia nigra and red nuclei were visible in all contrasts. In conclusion, high-resolution, multi-contrast MR imaging at 7 T is a versatile tool to non-invasively assess the individual anatomy and tissue composition of the human brainstem.

Keywords: anatomy; brain; brainstem; diffusion tensor imaging; effective transverse relaxation; longitudinal relaxation; quantitative susceptibility mapping; track-density imaging.


Figures

Figure 1
Figure 1
Images of the midbrain. R1, R2*, and susceptibility maps as well as direction-encoded track-density and T2-weighted images of the same brain region are presented in axial orientation from (A–E), respectively. Red, blue, and green in the track-density image represent anisotropy along medial-lateral, superior-inferior, and anterior-posterior directions, respectively. Note that the track-density image is slightly distorted compared to the other image contrasts (A–C,E). The sectional plane of the axial images is indicated by the dashed line overlaid on the sagittal R1 map shown in (F). Axial histological sections from a different subject stained for myelin and cells are illustrated in (G) and (H), respectively. The arrows in the images indicate: (a) mammillary body, (b) substantia nigra, (c) crus cerebri, (c1) corticobulbar fibers, (c2) corticospinal fibers, (c3) corticopontine fibers, (d) red nucleus, (e) medial lemniscus, (f) central tegmental tract, (g) inferior colliculus, and (h) medial longitudinal fasciculus. [The histological stains (G,H) were adapted with permission from http://www.brains.rad.msu.edu and http://brainmuseum.org, supported by the US National Science Foundation.]
Figure 2
Figure 2
Contrast-to-noise ratio (CNR) of selected anatomical regions. Mean values of CNR across six subjects and both hemispheres were extracted from R1 (blue bars), R2* (red bars), and susceptibility maps (green bars) as well as T2-weighted images (black bars). Brain regions include: RN - red nucleus vs. surrounding tissue, SN - substantia nigra vs. tissue between red nucleus and substantia nigra, CTT - central tegmental tract vs. surrounding tissue (without red nucleus), sup col - superior colliculus vs. adjacent tissue, inf col - inferior colliculus vs. adjacent tissue, RTN - reticulotegmental nucleus vs. surrounding white matter tissue, MCP - middle cerebellar peduncle vs. adjacent cerebrospinal fluid, SCP - superior cerebellar peduncle vs. reticular formation, TPF - transverse pontine fibers vs. corticospinal tract. The error bars indicate the 95%-confidence interval.
Figure 3
Figure 3
Images of the rostral part of the pons. R1, R2*, and susceptibility maps as well as direction-encoded track-density (same color-encoding as in Figure 1; slightly distorted compared to the other axial image contrasts) and T2-weighted images of the same region are presented in axial orientation from (A–E), respectively. The sectional plane of the axial images is indicated by the dashed line overlaid on the sagittal R1 map shown in (F). Axial histological sections from a different subject stained for myelin and cells are illustrated in (G) and (H), respectively. The arrows in the images indicate: (a) middle cerebellar peduncle, (b) medial lemniscus, (c) reticulotegmental nucleus, (d) superior cerebellar peduncle, (e) medial longitudinal fasciculus, (f) central tegmental tract, and (h) corticospinal tract. The solid white outline in (D) indicates the pontocerebellar fibers. [The histological stains (G,H) were adapted with permission from http://www.brains.rad.msu.edu and http://brainmuseum.org, supported by the US National Science Foundation.]
Figure 4
Figure 4
Images of the middle part of the pons. R1, R2*, and susceptibility maps as well as track-density (same color-encoding as in Figure 1; slightly distorted compared to the other axial image contrasts) and T2-weighted images of the same region are presented in axial orientation from (A–E), respectively. The sectional plane of the axial images is indicated by the dashed line overlaid on the sagittal R1 map shown in (F). Axial histological sections from a different subject stained for myelin and cells are illustrated in (G) and (H), respectively. The arrows in the images indicate: (a) middle cerebellar peduncle, (d) superior cerebellar peduncle, (e) medial longitudinal fasciculus, (h) corticospinal fibers, (i) pontocerebellar tract, (j) facial nucleus, (k) salivatory nucleus, (l) abducens nucleus, (m) solitary nucleus, (n) vein, (o) fiber bundle that traverses the pons in medial to lateral direction, and (p) fourth ventricle (cerebrospinal fluid). The solid white outline in (A–D) summarizes the caudal part of the pontine reticular nucleus, the facial nucleus, salivatory nucleus, and abducens nucleus. The dashed white outline in (D) indicates a region between the middle cerebellar peduncle that could not be resolved with TDI. [The histological stains (G,H) were adapted with permission from http://www.brains.rad.msu.edu and http://brainmuseum.org, supported by the US National Science Foundation.]
Figure 5
Figure 5
Images of the rostral part of the medulla oblongata. R1, R2*, and susceptibility maps as well as direction-encoded track-density (same color-encoding as in Figure 1; slightly distorted compared to the other axial image contrasts) and T2-weighted images of the same region are presented in axial orientation from (A–E), respectively. The sectional plane of the axial images is indicated by the dashed line overlaid on the sagittal R1 map shown in (F). Axial histological sections from a different subject stained for myelin and cells are illustrated in (G) and (H), respectively. The arrows indicate: (a) pyramid, (b) inferior olive, (c) spinal trigeminal nucleus, (d) inferior cerebellar peduncle, (e) medial longitudinal fasciculus, (f) medial lemniscus, (h) reticular formation, (i) accessory cuneate nucleus, (j) solitary nucleus, (k) dorsal motor nucleus of the vagus nerve, and (l) hypoglossal nucleus. [The histological stains (G,H) were adapted with permission from http://www.brains.rad.msu.edu and http://brainmuseum.org, supported by the US National Science Foundation.]
Figure 6
Figure 6
Images of the middle part of the medulla oblongata. R1, R2*, and susceptibility maps as well as track-density (same color-encoding as in Figure 1; slightly distorted compared to the other axial image contrasts) and T2-weighted images of the same region are presented in axial orientation from (A–E), respectively. The sectional plane of the axial images is indicated by the dashed line overlaid on the sagittal R1 map shown in (F). The arrows in the images indicate: (a) pyramid, (b) inferior olive, and (d) inferior cerebellar peduncle.

Similar articles

Cited by

References

    1. Basser P. J., Pierpaoli C. (1996). Microstructural and physiological features of tissues elucidated by quantitative-diffusion-tensor MRI. J. Magn. Reson. B. 111, 209–21910.1006/jmrb.1996.0086 - DOI - PubMed
    1. Bender B., Klose U. (2010). The in vivo influence of white matter fiber orientation towards B(0) on T2* in the human brain. NMR Biomed. 23, 1071–107610.1002/nbm.1534 - DOI - PubMed
    1. Bergman R. A., Afifi A. K., Heidger P. M. (eds). (1989). “Atlas of microscopic anatomy: companion to histology and neuroanatomy,” in Central Nervous System, 2nd Edn (Philadelphia: W. B. Saunders Company; ), 418–495
    1. Bilgic B., Pfefferbaum A., Rohlfing T., Sullivan E. V., Adalsteinsson E. (2012). MRI estimates of brain iron concentration in normal aging using quantitative susceptibility mapping. Neuroimage 59, 2625–263510.1016/j.neuroimage.2011.08.077 - DOI - PMC - PubMed
    1. Bridge H., Clare S. (2006). High-resolution MRI: in vivo histology? Philos. Trans. R. Soc. Lond. B Biol. Sci. 361, 137–14610.1098/rstb.2005.1777 - DOI - PMC - PubMed

LinkOut - more resources