Audio-visual perception of 3D cinematography: an fMRI study using condition-based and computation-based analyses
- PMID: 24194828
- PMCID: PMC3806767
- DOI: 10.1371/journal.pone.0076003
Audio-visual perception of 3D cinematography: an fMRI study using condition-based and computation-based analyses
Abstract
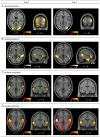
The use of naturalistic stimuli to probe sensory functions in the human brain is gaining increasing interest. Previous imaging studies examined brain activity associated with the processing of cinematographic material using both standard "condition-based" designs, as well as "computational" methods based on the extraction of time-varying features of the stimuli (e.g. motion). Here, we exploited both approaches to investigate the neural correlates of complex visual and auditory spatial signals in cinematography. In the first experiment, the participants watched a piece of a commercial movie presented in four blocked conditions: 3D vision with surround sounds (3D-Surround), 3D with monaural sound (3D-Mono), 2D-Surround, and 2D-Mono. In the second experiment, they watched two different segments of the movie both presented continuously in 3D-Surround. The blocked presentation served for standard condition-based analyses, while all datasets were submitted to computation-based analyses. The latter assessed where activity co-varied with visual disparity signals and the complexity of auditory multi-sources signals. The blocked analyses associated 3D viewing with the activation of the dorsal and lateral occipital cortex and superior parietal lobule, while the surround sounds activated the superior and middle temporal gyri (S/MTG). The computation-based analyses revealed the effects of absolute disparity in dorsal occipital and posterior parietal cortices and of disparity gradients in the posterior middle temporal gyrus plus the inferior frontal gyrus. The complexity of the surround sounds was associated with activity in specific sub-regions of S/MTG, even after accounting for changes of sound intensity. These results demonstrate that the processing of naturalistic audio-visual signals entails an extensive set of visual and auditory areas, and that computation-based analyses can track the contribution of complex spatial aspects characterizing such life-like stimuli.
Conflict of interest statement
Figures


Similar articles
-
Sensory processing during viewing of cinematographic material: computational modeling and functional neuroimaging.Neuroimage. 2013 Feb 15;67:213-26. doi: 10.1016/j.neuroimage.2012.11.031. Epub 2012 Nov 29. Neuroimage. 2013. PMID: 23202431 Free PMC article.
-
Neuromagnetic activation and oscillatory dynamics of stimulus-locked processing during naturalistic viewing.Neuroimage. 2020 Aug 1;216:116414. doi: 10.1016/j.neuroimage.2019.116414. Epub 2019 Nov 30. Neuroimage. 2020. PMID: 31794854
-
Retinotopic effects during spatial audio-visual integration.Neuropsychologia. 2007 Feb 1;45(3):531-9. doi: 10.1016/j.neuropsychologia.2006.05.018. Epub 2006 Jun 23. Neuropsychologia. 2007. PMID: 16797610
-
Stimulus-dependent activations and attention-related modulations in the auditory cortex: a meta-analysis of fMRI studies.Hear Res. 2014 Jan;307:29-41. doi: 10.1016/j.heares.2013.08.001. Epub 2013 Aug 11. Hear Res. 2014. PMID: 23938208 Review.
-
Segmental processing in the human auditory dorsal stream.Brain Res. 2008 Jul 18;1220:179-90. doi: 10.1016/j.brainres.2007.11.013. Epub 2007 Nov 17. Brain Res. 2008. PMID: 18096139 Review.
Cited by
-
Temporal Audiovisual Motion Prediction in 2D- vs. 3D-Environments.Front Psychol. 2018 Mar 21;9:368. doi: 10.3389/fpsyg.2018.00368. eCollection 2018. Front Psychol. 2018. PMID: 29618999 Free PMC article.
-
Time-varying measures of cerebral network centrality correlate with visual saliency during movie watching.Brain Behav. 2021 Sep;11(9):e2334. doi: 10.1002/brb3.2334. Epub 2021 Aug 26. Brain Behav. 2021. PMID: 34435748 Free PMC article.
-
Movies and narratives as naturalistic stimuli in neuroimaging.Neuroimage. 2021 Jan 1;224:117445. doi: 10.1016/j.neuroimage.2020.117445. Epub 2020 Oct 12. Neuroimage. 2021. PMID: 33059053 Free PMC article. Review.
-
Orienting of visuo-spatial attention in complex 3D space: Search and detection.Hum Brain Mapp. 2015 Jun;36(6):2231-47. doi: 10.1002/hbm.22767. Epub 2015 Feb 17. Hum Brain Mapp. 2015. PMID: 25691253 Free PMC article.
-
Time-resolved detection of stimulus/task-related networks, via clustering of transient intersubject synchronization.Hum Brain Mapp. 2015 Sep;36(9):3404-25. doi: 10.1002/hbm.22852. Epub 2015 Jun 12. Hum Brain Mapp. 2015. PMID: 26095530 Free PMC article.
References
-
- Sanchez-Vives MV, Slater M (2005) From presence to consciousness through virtual reality. Nat Rev Neurosci 6: 332–339. - PubMed
-
- Bartels A, Zeki S, Logothetis NK (2008) Natural vision reveals regional specialization to local motion and to contrast-invariant, global flow in the human brain. Cereb Cortex 18: 705–717. - PubMed
-
- Fiser J, Chiu C, Weliky M (2004) Small modulation of ongoing cortical dynamics by sensory input during natural vision. Nature 431: 573–578. - PubMed
Publication types
MeSH terms
Grants and funding
LinkOut - more resources
Full Text Sources
Other Literature Sources

