

CDPK1 from ginger promotes salinity and drought stress tolerance without yield penalty by improving growth and photosynthesis in Nicotiana tabacum
- PMID: 24194837
- PMCID: PMC3806807
- DOI: 10.1371/journal.pone.0076392
CDPK1 from ginger promotes salinity and drought stress tolerance without yield penalty by improving growth and photosynthesis in Nicotiana tabacum
Abstract
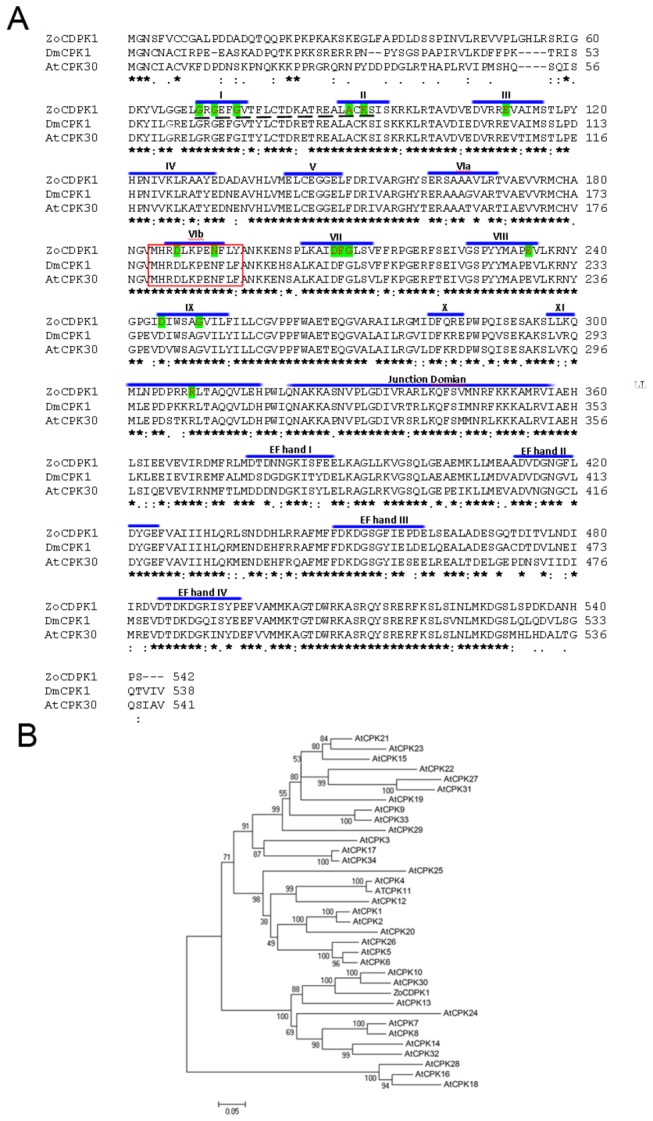
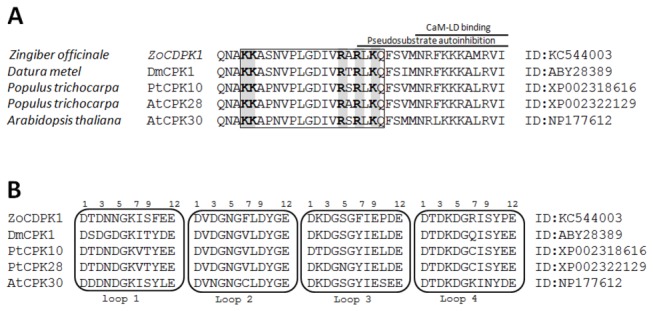
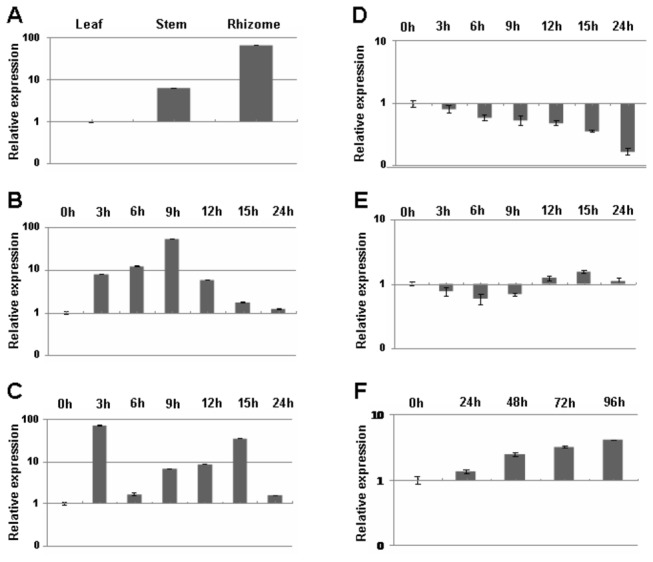
In plants, transient changes in calcium concentrations of cytosol have been observed during stress conditions like high salt, drought, extreme temperature and mechanical disturbances. Calcium-dependent protein kinases (CDPKs) play important roles in relaying these calcium signatures into downstream effects. In this study, a stress-responsive CDPK gene, ZoCDPK1 was isolated from a stress cDNA generated from ginger using rapid amplification of cDNA ends (RLM-RACE) - PCR technique and characterized its role in stress tolerance. An important aspect seen during the analysis of the deduced protein is a rare coupling between the presence of a nuclear localization sequence in the junction domain and consensus sequence in the EF-hand loops of calmodulin-like domain. ZoCDPK1 is abundantly expressed in rhizome and is rapidly induced by high-salt stress, drought, and jasmonic acid treatment but not by low temperature stress or abscissic acid treatment. The sub-cellular localization of ZoCDPK1-GFP fusion protein was studied in transgenic tobacco epidermal cells using confocal laser scanning microscopy. Over-expression of ginger CDPK1 gene in tobacco conferred tolerance to salinity and drought stress as reflected by the high percentage of seed germination, higher relative water content, expression of stress responsive genes, higher leaf chlorophyll content, increased photosynthetic efficiency and other photosynthetic parameters. In addition, transgenic tobacco subjected to salinity/drought stress exhibited 50% more growth during stress conditions as compared to wild type plant during normal conditions. T3 transgenic plants are able to grow to maturity, flowers early and set viable seeds under continuous salinity or drought stress without yield penalty. The ZoCDPK1 up-regulated the expression levels of stress-related genes RD21A and ERD1 in tobacco plants. These results suggest that ZoCDPK1 functions in the positive regulation of the signaling pathways that are involved in the response to salinity and drought stress in ginger and it is likely operating in a DRE/CRT independent manner.
Conflict of interest statement
Figures


Similar articles
-
Calcium-Dependent Protein Kinase in Ginger Binds with Importin-α through Its Junction Domain for Nuclear Localization, and Further Interacts with NAC Transcription Factor.Front Plant Sci. 2017 Jan 13;7:1909. doi: 10.3389/fpls.2016.01909. eCollection 2016. Front Plant Sci. 2017. PMID: 28133460 Free PMC article.
-
A single subunit MCM6 from pea promotes salinity stress tolerance without affecting yield.Plant Mol Biol. 2011 May;76(1-2):19-34. doi: 10.1007/s11103-011-9758-0. Epub 2011 Mar 2. Plant Mol Biol. 2011. PMID: 21365356
-
Over-expression of the peroxisomal ascorbate peroxidase (SbpAPX) gene cloned from halophyte Salicornia brachiata confers salt and drought stress tolerance in transgenic tobacco.Mar Biotechnol (NY). 2014 Jun;16(3):321-32. doi: 10.1007/s10126-013-9548-6. Epub 2013 Oct 3. Mar Biotechnol (NY). 2014. PMID: 24197564
-
Advances in salt tolerance molecular mechanism in tobacco plants.Hereditas. 2020 Feb 24;157(1):5. doi: 10.1186/s41065-020-00118-0. Hereditas. 2020. PMID: 32093781 Free PMC article. Review.
-
[Functions and mechanisms of CDPKs in plant responses to abiotic stress].Sheng Wu Gong Cheng Xue Bao. 2024 Oct 25;40(10):3337-3359. doi: 10.13345/j.cjb.230827. Sheng Wu Gong Cheng Xue Bao. 2024. PMID: 39467737 Review. Chinese.
Cited by
-
A genome-wide transcriptome map of pistachio (Pistacia vera L.) provides novel insights into salinity-related genes and marker discovery.BMC Genomics. 2017 Aug 17;18(1):627. doi: 10.1186/s12864-017-3989-7. BMC Genomics. 2017. PMID: 28814265 Free PMC article.
-
Stress Inducible Expression of AtDREB1A Transcription Factor in Transgenic Peanut (Arachis hypogaea L.) Conferred Tolerance to Soil-Moisture Deficit Stress.Front Plant Sci. 2016 Jun 28;7:935. doi: 10.3389/fpls.2016.00935. eCollection 2016. Front Plant Sci. 2016. PMID: 27446163 Free PMC article.
-
The Arabidopsis PLAT domain protein1 promotes abiotic stress tolerance and growth in tobacco.Transgenic Res. 2015 Aug;24(4):651-63. doi: 10.1007/s11248-015-9868-6. Epub 2015 Mar 11. Transgenic Res. 2015. PMID: 25757741
-
Na2CO3-responsive mechanisms in halophyte Puccinellia tenuiflora roots revealed by physiological and proteomic analyses.Sci Rep. 2016 Sep 6;6:32717. doi: 10.1038/srep32717. Sci Rep. 2016. PMID: 27596441 Free PMC article.
-
Calcium-dependent protein kinases in cotton: insights into early plant responses to salt stress.BMC Plant Biol. 2018 Jan 17;18(1):15. doi: 10.1186/s12870-018-1230-8. BMC Plant Biol. 2018. PMID: 29343239 Free PMC article.
References
Publication types
MeSH terms
Substances
LinkOut - more resources
Full Text Sources
Other Literature Sources
Research Materials
