

Heart rate responses to autonomic challenges in obstructive sleep apnea
- PMID: 24194842
- PMCID: PMC3806804
- DOI: 10.1371/journal.pone.0076631
Heart rate responses to autonomic challenges in obstructive sleep apnea
Abstract
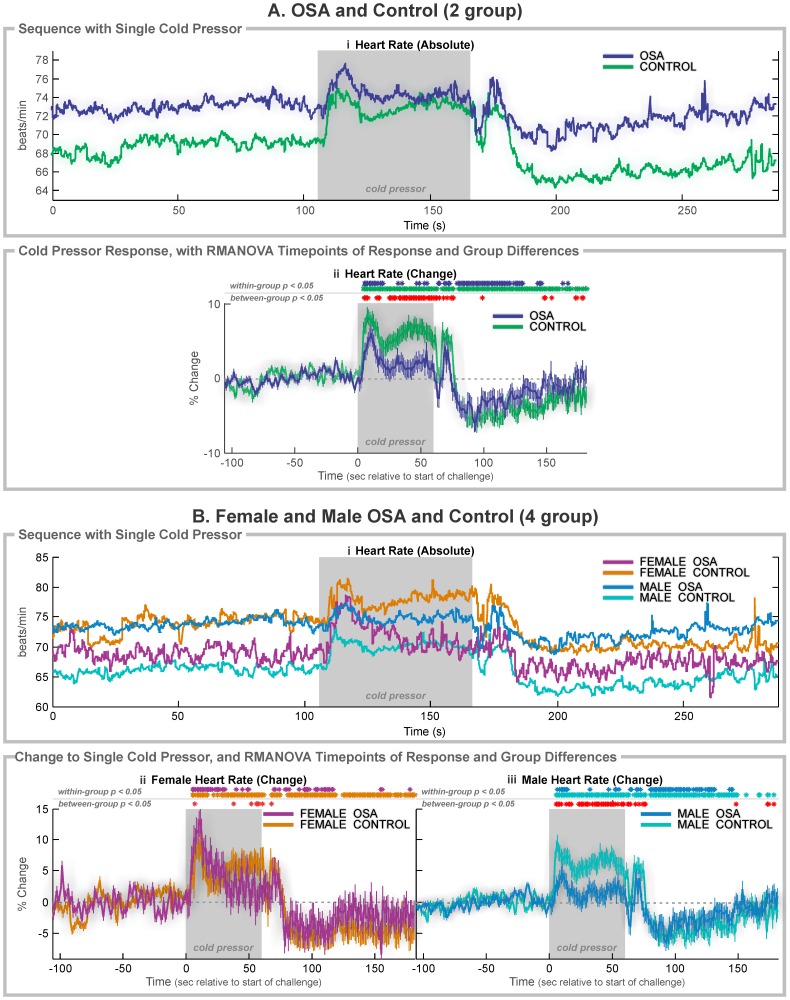
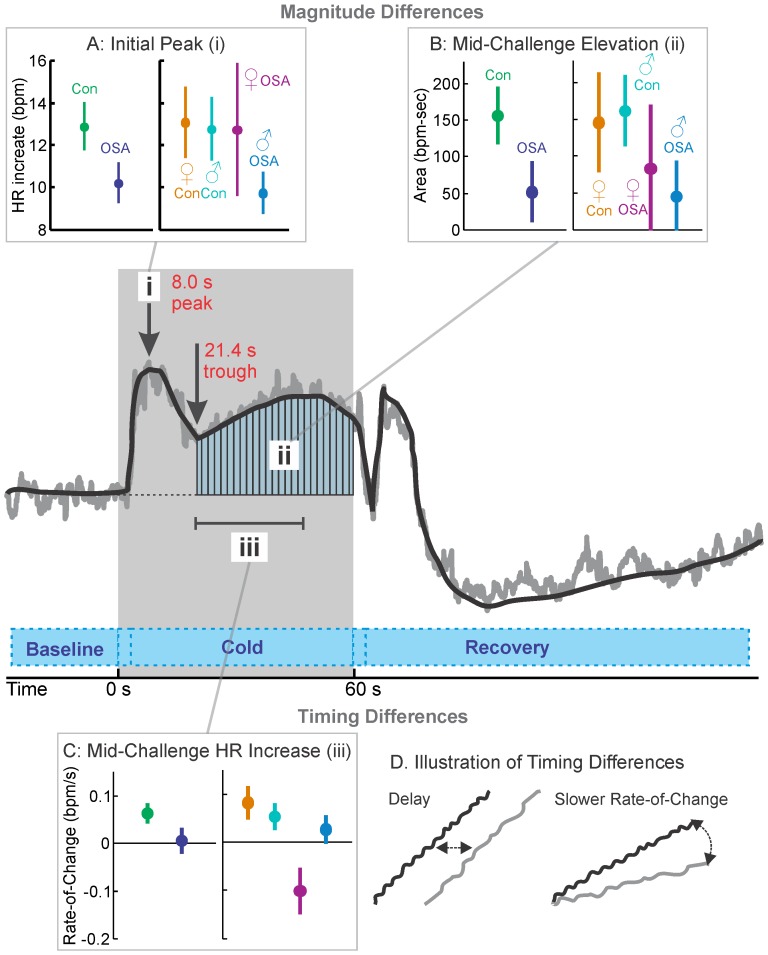
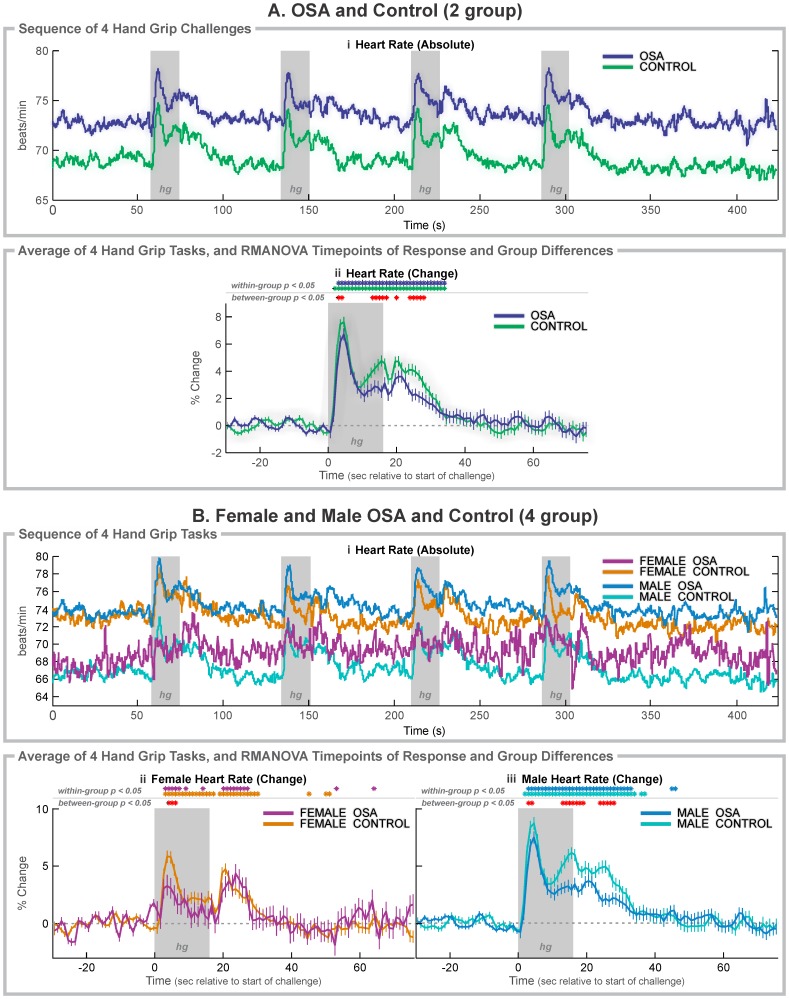
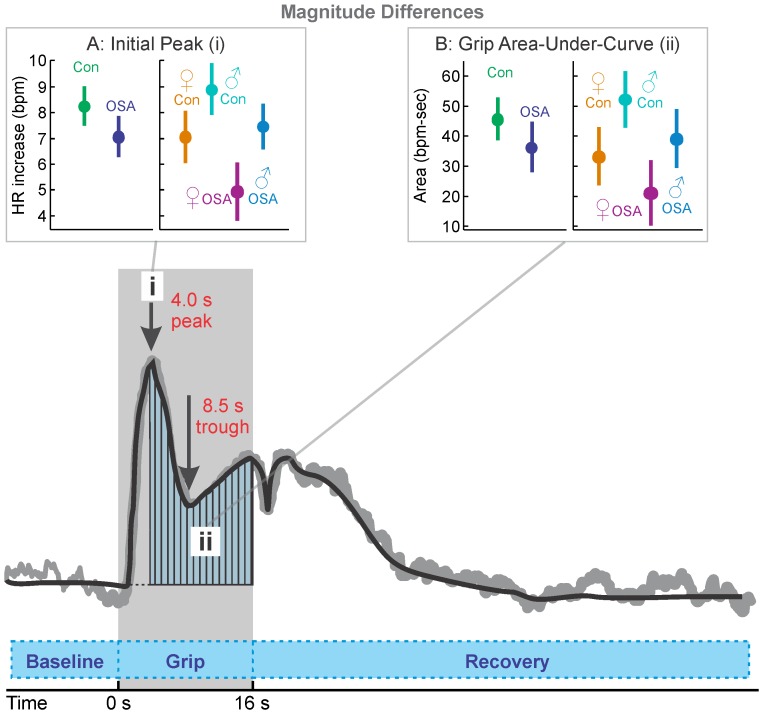
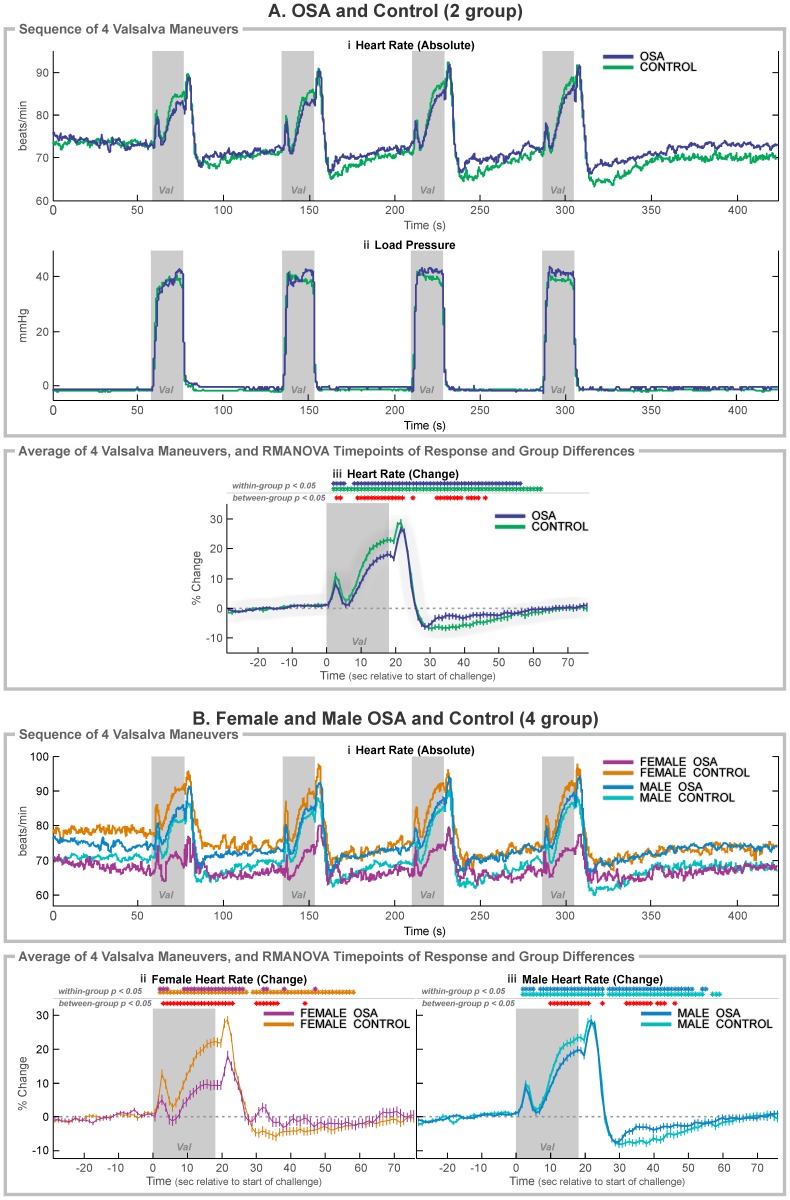
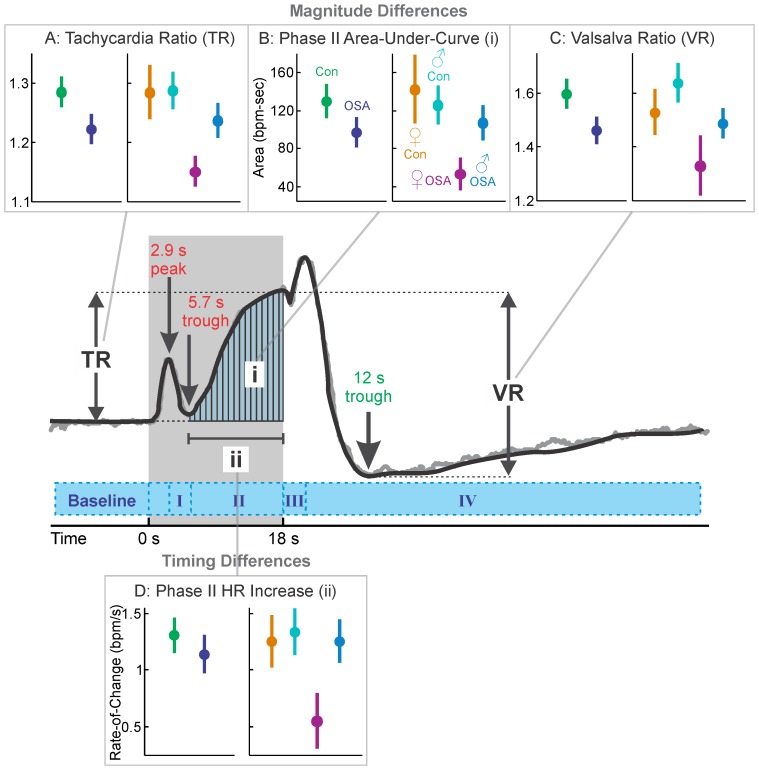
Obstructive sleep apnea (OSA) is accompanied by structural alterations and dysfunction in central autonomic regulatory regions, which may impair dynamic and static cardiovascular regulation, and contribute to other syndrome pathologies. Characterizing cardiovascular responses to autonomic challenges may provide insights into central nervous system impairments, including contributions by sex, since structural alterations are enhanced in OSA females over males. The objective was to assess heart rate responses in OSA versus healthy control subjects to autonomic challenges, and, separately, characterize female and male patterns. We studied 94 subjects, including 37 newly-diagnosed, untreated OSA patients (6 female, age mean ± std: 52.1 ± 8.1 years; 31 male aged 54.3 ± 8.4 years), and 57 healthy control subjects (20 female, 50.5 ± 8.1 years; 37 male, 45.6 ± 9.2 years). We measured instantaneous heart rate with pulse oximetry during cold pressor, hand grip, and Valsalva maneuver challenges. All challenges elicited significant heart rate differences between OSA and control groups during and after challenges (repeated measures ANOVA, p<0.05). In post-hoc analyses, OSA females showed greater impairments than OSA males, which included: for cold pressor, lower initial increase (OSA vs. control: 9.5 vs. 7.3 bpm in females, 7.6 vs. 3.7 bpm in males), OSA delay to initial peak (2.5 s females/0.9 s males), slower mid-challenge rate-of-increase (OSA vs. control: -0.11 vs. 0.09 bpm/s in females, 0.03 vs. 0.06 bpm/s in males); for hand grip, lower initial peak (OSA vs. control: 2.6 vs. 4.6 bpm in females, 5.3 vs. 6.0 bpm in males); for Valsalva maneuver, lower Valsalva ratio (OSA vs. control: 1.14 vs. 1.30 in females, 1.29 vs. 1.34 in males), and OSA delay during phase II (0.68 s females/1.31 s males). Heart rate responses showed lower amplitude, delayed onset, and slower rate changes in OSA patients over healthy controls, and impairments may be more pronounced in females. The dysfunctions may reflect central injury in the syndrome, and suggest autonomic deficiencies that may contribute to further tissue and functional pathologies.
Conflict of interest statement
Figures
Similar articles
-
Global brain blood-oxygen level responses to autonomic challenges in obstructive sleep apnea.PLoS One. 2014 Aug 28;9(8):e105261. doi: 10.1371/journal.pone.0105261. eCollection 2014. PLoS One. 2014. PMID: 25166862 Free PMC article.
-
Insular functional organization during handgrip in females and males with obstructive sleep apnea.PLoS One. 2021 Feb 18;16(2):e0246368. doi: 10.1371/journal.pone.0246368. eCollection 2021. PLoS One. 2021. PMID: 33600443 Free PMC article.
-
Functional organization of the insula in men and women with obstructive sleep apnea during Valsalva.Sleep. 2021 Jan 21;44(1):zsaa124. doi: 10.1093/sleep/zsaa124. Sleep. 2021. PMID: 32592491 Free PMC article.
-
Obstructive sleep apnea syndrome and autonomic dysfunction.Auton Neurosci. 2019 Nov;221:102563. doi: 10.1016/j.autneu.2019.102563. Epub 2019 Jul 10. Auton Neurosci. 2019. PMID: 31445406 Review.
-
Functional neuroanatomy and sleep-disordered breathing: implications for autonomic regulation.Anat Rec (Hoboken). 2012 Sep;295(9):1385-95. doi: 10.1002/ar.22514. Epub 2012 Jul 31. Anat Rec (Hoboken). 2012. PMID: 22851218 Review.
Cited by
-
Beat-to-beat blood pressure variability in patients with obstructive sleep apnea.J Clin Sleep Med. 2021 Mar 1;17(3):381-392. doi: 10.5664/jcsm.8866. J Clin Sleep Med. 2021. PMID: 33089774 Free PMC article.
-
Global brain blood-oxygen level responses to autonomic challenges in obstructive sleep apnea.PLoS One. 2014 Aug 28;9(8):e105261. doi: 10.1371/journal.pone.0105261. eCollection 2014. PLoS One. 2014. PMID: 25166862 Free PMC article.
-
Functional Imaging of Autonomic Regulation: Methods and Key Findings.Front Neurosci. 2016 Jan 26;9:513. doi: 10.3389/fnins.2015.00513. eCollection 2015. Front Neurosci. 2016. PMID: 26858595 Free PMC article. Review.
-
Reversal of functional changes in the brain associated with obstructive sleep apnoea following 6 months of CPAP.Neuroimage Clin. 2015 Feb 21;7:799-806. doi: 10.1016/j.nicl.2015.02.010. eCollection 2015. Neuroimage Clin. 2015. PMID: 26082888 Free PMC article.
-
Sex differences in forearm vasoconstrictor response to voluntary apnea.Am J Physiol Heart Circ Physiol. 2014 Feb;306(3):H309-16. doi: 10.1152/ajpheart.00746.2013. Epub 2013 Dec 6. Am J Physiol Heart Circ Physiol. 2014. PMID: 24322616 Free PMC article.
References
-
- Young T, Peppard PE, Gottlieb DJ (2002) Epidemiology of obstructive sleep apnea: a population health perspective. Am J Respir Crit Care Med 165: 1217–1239. - PubMed
-
- Macey KE, Macey PM, Woo MA, Henderson LA, Frysinger RC, et al. (2006) Inspiratory loading elicits aberrant fMRI signal changes in obstructive sleep apnea. Respir Physiol Neurobiol 151: 44–60. - PubMed
-
- Macey PM, Henderson LA, Macey KE, Alger JR, Frysinger RC, et al. (2002) Brain morphology associated with obstructive sleep apnea. Am J Respir Crit Care Med 166: 1382–1387. - PubMed
Publication types
MeSH terms
Grants and funding
LinkOut - more resources
Full Text Sources
Other Literature Sources
Medical
Research Materials
