

Altered orientation and flight paths of pigeons reared on gravity anomalies: a GPS tracking study
- PMID: 24194860
- PMCID: PMC3806762
- DOI: 10.1371/journal.pone.0077102
Altered orientation and flight paths of pigeons reared on gravity anomalies: a GPS tracking study
Abstract
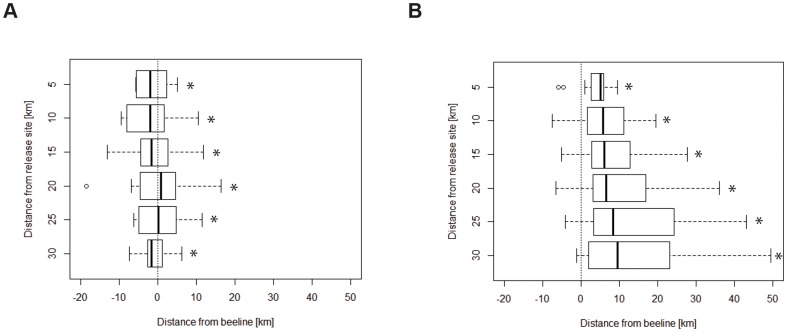
The mechanisms of pigeon homing are still not understood, in particular how they determine their position at unfamiliar locations. The "gravity vector" theory holds that pigeons memorize the gravity vector at their home loft and deduct home direction and distance from the angular difference between memorized and actual gravity vector. However, the gravity vector is tilted by different densities in the earth crust leading to gravity anomalies. We predicted that pigeons reared on different gravity anomalies would show different initial orientation and also show changes in their flight path when crossing a gravity anomaly. We reared one group of pigeons in a strong gravity anomaly with a north-to-south gravity gradient, and the other group of pigeons in a normal area but on a spot with a strong local anomaly with a west-to-east gravity gradient. After training over shorter distances, pigeons were released from a gravitationally and geomagnetically normal site 50 km north in the same direction for both home lofts. As expected by the theory, the two groups of pigeons showed divergent initial orientation. In addition, some of the GPS-tracked pigeons also showed changes in their flight paths when crossing gravity anomalies. We conclude that even small local gravity anomalies at the birth place of pigeons may have the potential to bias the map sense of pigeons, while reactivity to gravity gradients during flight was variable and appeared to depend on individual navigational strategies and frequency of position updates.
Conflict of interest statement
Figures


Similar articles
-
Cues indicating location in pigeon navigation.J Comp Physiol A Neuroethol Sens Neural Behav Physiol. 2015 Oct;201(10):961-7. doi: 10.1007/s00359-015-1027-2. Epub 2015 Jul 7. J Comp Physiol A Neuroethol Sens Neural Behav Physiol. 2015. PMID: 26149606 Review.
-
Gravity anomalies without geomagnetic disturbances interfere with pigeon homing--a GPS tracking study.J Exp Biol. 2014 Nov 15;217(Pt 22):4057-67. doi: 10.1242/jeb.108670. J Exp Biol. 2014. PMID: 25392461
-
Testing cognitive navigation in unknown territories: homing pigeons choose different targets.J Exp Biol. 2013 Aug 15;216(Pt 16):3123-31. doi: 10.1242/jeb.083246. J Exp Biol. 2013. PMID: 23885090
-
Tracking clock-shifted homing pigeons from familiar release sites.J Exp Biol. 2000 Jan;203(Pt 2):207-12. doi: 10.1242/jeb.203.2.207. J Exp Biol. 2000. PMID: 10607530
-
Requiem for a heavyweight - can anything more be learned from homing pigeons about the sensory and spatial-representational basis of avian navigation?J Exp Biol. 2018 Oct 22;221(Pt 20):jeb163089. doi: 10.1242/jeb.163089. J Exp Biol. 2018. PMID: 30348670 Review.
Cited by
-
Pigeon navigation: different routes lead to Frankfurt.PLoS One. 2014 Nov 12;9(11):e112439. doi: 10.1371/journal.pone.0112439. eCollection 2014. PLoS One. 2014. PMID: 25391144 Free PMC article.
-
Cues indicating location in pigeon navigation.J Comp Physiol A Neuroethol Sens Neural Behav Physiol. 2015 Oct;201(10):961-7. doi: 10.1007/s00359-015-1027-2. Epub 2015 Jul 7. J Comp Physiol A Neuroethol Sens Neural Behav Physiol. 2015. PMID: 26149606 Review.
-
Pigeon homing from unfamiliar areas: An alternative to olfactory navigation is not in sight.Commun Integr Biol. 2014 Apr 3;7:e28565. doi: 10.4161/cib.28565. eCollection 2014. Commun Integr Biol. 2014. PMID: 25346789 Free PMC article.
-
Diversity in olfactory bulb size in birds reflects allometry, ecology, and phylogeny.Front Neuroanat. 2015 Jul 29;9:102. doi: 10.3389/fnana.2015.00102. eCollection 2015. Front Neuroanat. 2015. PMID: 26283931 Free PMC article.
References
-
- Kramer G (1953) Wird die Sonnenhöhe bei der Heimfindeorientierung verwertet? J Ornithol 201–219.
-
- Schmidt-Koenig K (1960) The sun azimuth compass: one factor in the orientation of homing pigeons. Science 131: 826–828. - PubMed
-
- Emlen ST (1970) Celestial rotation: its importance in the development of migratory orientation. Science 170: 1198–1201. - PubMed
-
- Able KP, Able MA (1990) Calibration of the magnetic compass of a migratory bird by celestial rotation. Nature 347: 378–380.
-
- Able KP (1994) Magnetic orientation and magnetoreception in birds. Prog Neurobiol 42: 449–473. - PubMed
Publication types
MeSH terms
LinkOut - more resources
Full Text Sources
Other Literature Sources
Research Materials
