Comparative Study
. 2013 Oct 23;8(10):e77232.
doi: 10.1371/journal.pone.0077232. eCollection 2013.

High-throughput 3D screening reveals differences in drug sensitivities between culture models of JIMT1 breast cancer cells

Affiliations
Comparative Study

High-throughput 3D screening reveals differences in drug sensitivities between culture models of JIMT1 breast cancer cells

Vesa Hongisto et al. PLoS One. .

Abstract

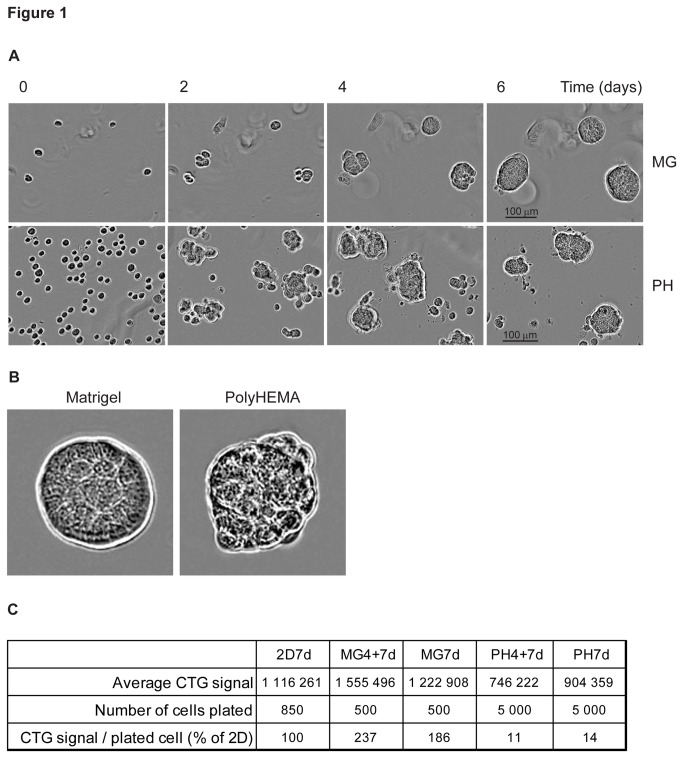
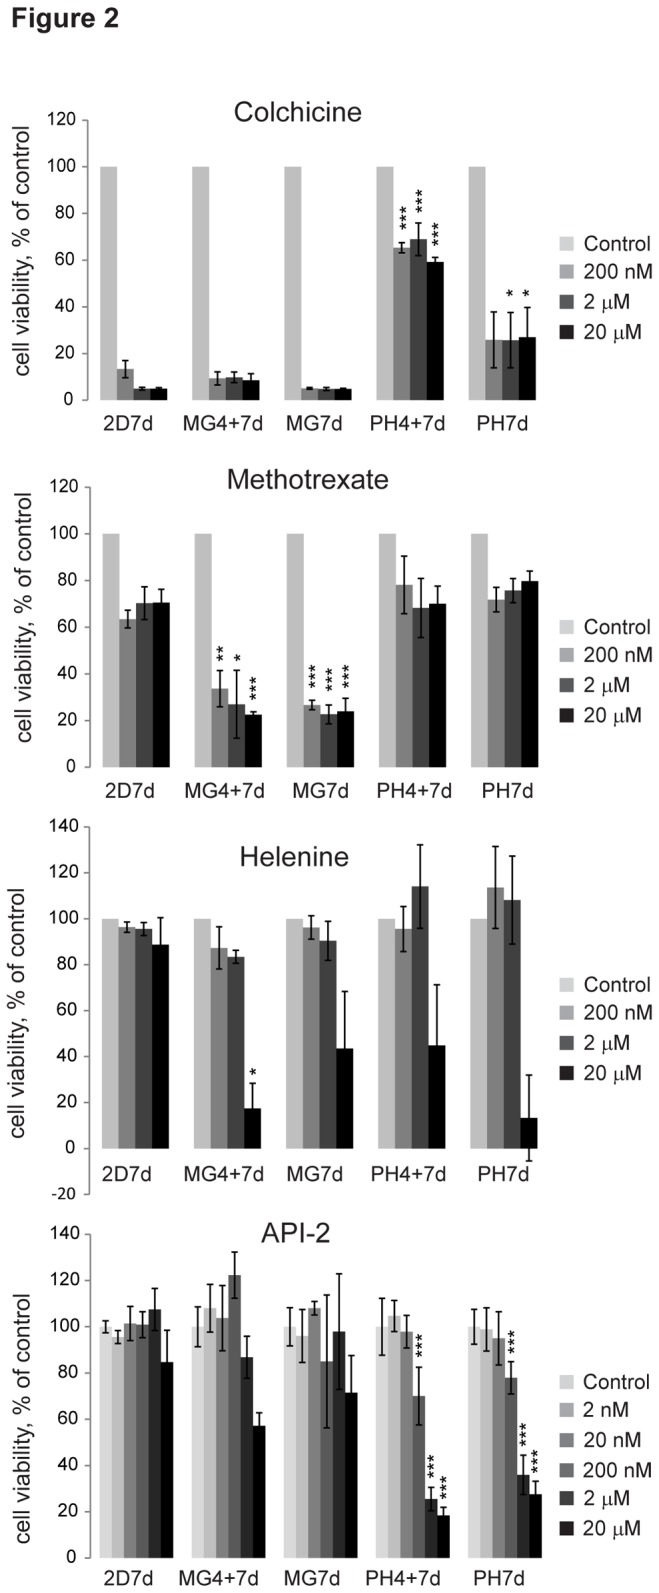
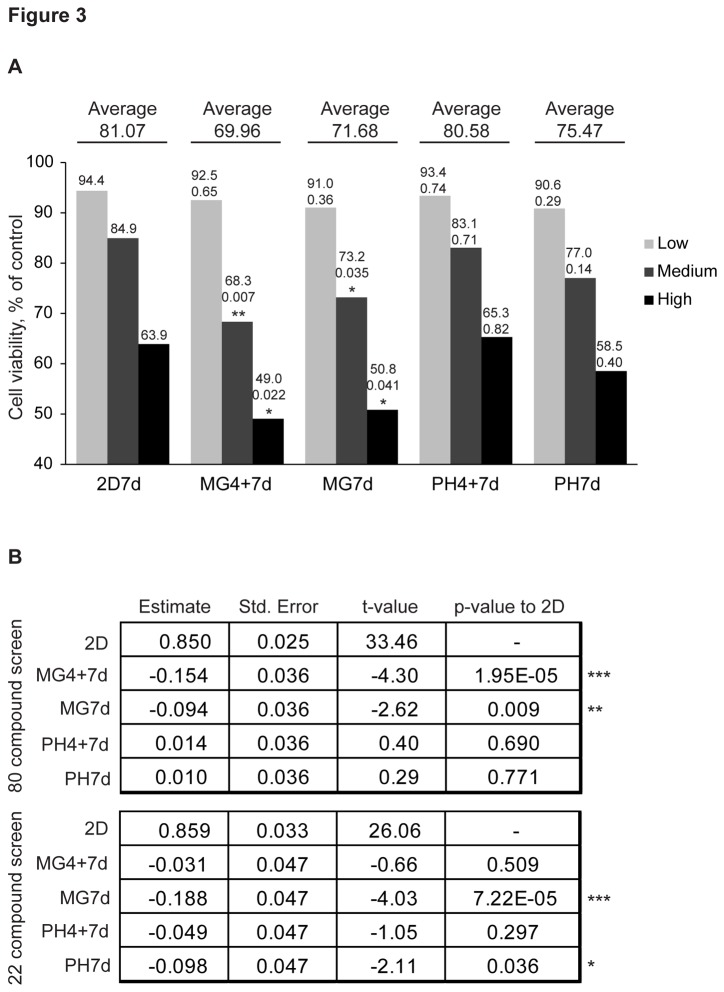
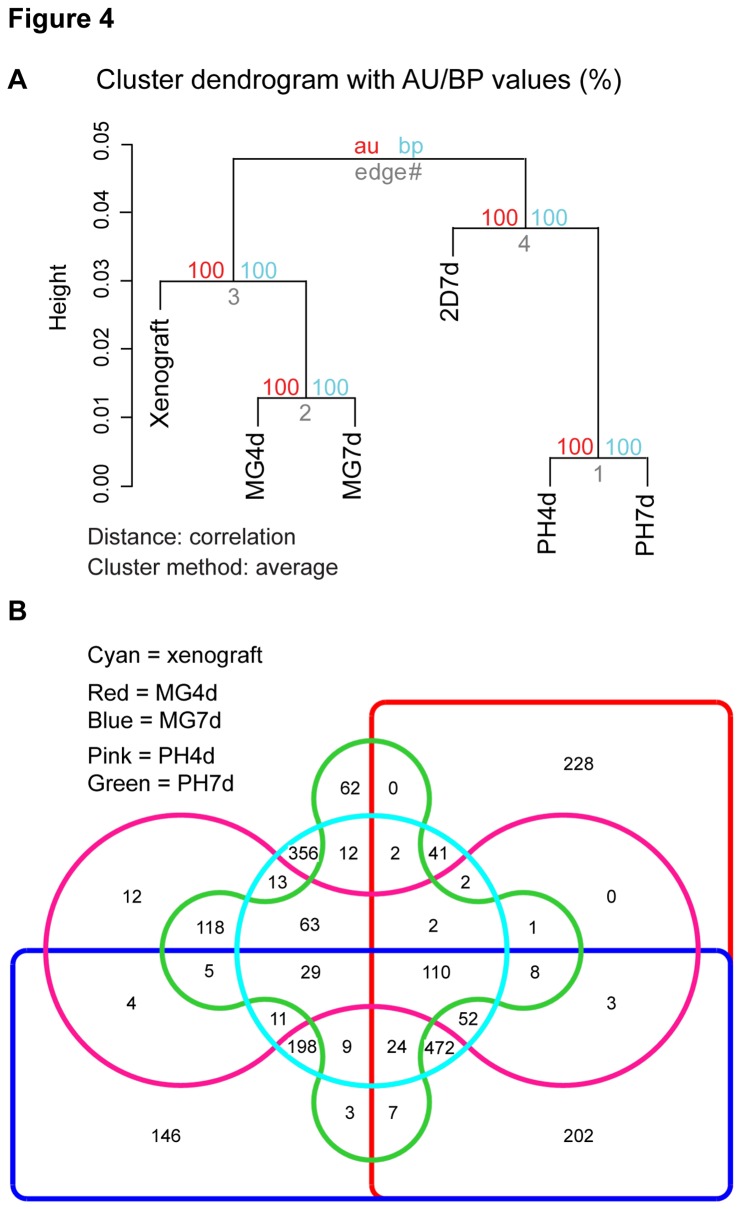
The traditional method for studying cancer in vitro is to grow immortalized cancer cells in two-dimensional monolayers on plastic. However, many cellular features are impaired in these artificial conditions, and large changes in gene expression compared to tumors have been reported. Three-dimensional cell culture models have become increasingly popular and are suggested to be better models than two-dimensional monolayers due to improved cell-to-cell contact and structures that resemble in vivo architecture. The aim of this study was to develop a simple high-throughput three-dimensional drug screening method and to compare drug responses in JIMT1 breast cancer cells when grown in two dimensions, in poly(2-hydroxyethyl methacrylate) induced anchorage-independent three-dimensional models, and in Matrigel three-dimensional cell culture models. We screened 102 compounds with multiple concentrations and biological replicates for their effects on cell proliferation. The cells were either treated immediately upon plating, or they were allowed to grow in three-dimensional cultures for 4 days before the drug treatment. Large variations in drug responses were observed between the models indicating that comparisons of culture model-influenced drug sensitivities cannot be made based on the effects of a single drug. However, we show with the 63 most prominent drugs that, in general, JIMT1 cells grown on Matrigel were significantly more sensitive to drugs than cells grown in two-dimensional cultures, while the responses of cells grown in poly(2-hydroxyethyl methacrylate) resembled those of the two-dimensional cultures. Furthermore, comparing the gene expression profiles of the cell culture models to xenograft tumors indicated that cells cultured in Matrigel and as xenografts most closely resembled each other. In this study, we also suggest that three-dimensional cultures can provide a platform for systematic experimentation of larger compound collections in a high-throughput mode and be used as alternatives to traditional two-dimensional screens for better comparability to the in vivo state.


Conflict of interest statement

Competing Interests: The authors have declared that no competing interests exist.

Figures

Figure 1
Figure 1. JIMT1 cells form mass-shaped structures in 3D.
A. Time series of JIMT1 cells grown as either a Matrigel (MG) or polyHEMA (PH) culture. B. Zoom-in representative images of mass-shaped JIMT1 structures in Matrigel and polyHEMA. C. Growth rate comparison of 2D, Matrigel, and polyHEMA cultures. The growth rate was calculated by dividing the CTG (CellTiter-Glo) read by the starting cell number and expressed as % of 2D. Pictures were taken with IncuCyte.
Figure 2
Figure 2. Drug screening shows differences between the culture models and responses to individual drugs vary greatly.
Cells cultured in 2D, Matrigel (MG4+7d, MG7d), or polyHEMA (PH4+7d, PH7d) were treated with colchicine, methotrexate, helenine or API-2 with the indicated concentrations for 7 days. The cells were treated either directly up on plating for 7 days (2D7d, MG7d, PH7d) or after 4 day pre-growth at 3D (MG4+7d, PH4+7d). CellTiter-Glo (CTG) was used as a cell viability measure; data are an average of three biological replicates. Error bars are STDEV, * indicate statistically (t-test) significant changes compared to the corresponding 2D7d concentration, * < 0.05, ** < 0.01, *** < 0.001.
Figure 3
Figure 3. JIMT1 cells are more sensitive to drugs in Matrigel.
A. Average drug response of the JIMT1 cells in different cell culture models. The average responses of the 63 drugs are shown individually for the three highest concentrations (high (0.34-20 µM), medium (0.034-2 µM), and low (0.0034-0.2 µM) and across the concentrations. Response, p-value, and significance (** < 0.01, * < 0.05) compared to 2D are shown above the bars and average across the concentrations is shown above the line. Drug annotations and concentrations used for each drug are shown in File S1. B. Multiple linear regression analysis of individual drug screens comparing general drug effects to 2D. T-value shows the response difference to 2D (33.46 or 26.06). ***< 0.001, **<0.01, *<0.05.
Figure 4
Figure 4. Gene expression of JIMT1 cells grown in Matrigel is closest to xenografts.
A. Dendrogram showing hierarchical clustering of genome-wide gene expression data. au = approximately unbiased p-value (%) in red, bp = bootstrap probability value (%) in blue, edge = cluster number in gray. Data shown are the average of two biological RNA replicates. Correlation of the replicates is shown in File S6 B. Venn diagram of ≥2-fold upregulated genes compared to 2D7d shows the number of shared genes in every combination of culture models. A list of common genes for each category is shown in File S4.
Figure 5
Figure 5. HER2 signaling is altered in xenograft.
The most significantly altered upstream regulator in xenograft compared to 2D according to IPA; the HER2 pathway with arrows pointing to the top five changing genes shown in Table 1. Genes in red were upregulated in xenografts, and genes in green were downregulated. The 200 most upregulated and the 200 most downregulated genes in the xenografts compared to the 2D cultures were subjected to IPA analysis using the log-fold differences in expression as comparison values.
Figure 6
Figure 6. Interferon pathway is activated in polyHEMA cultures.
A. The canonical pathway that changed the most in PH4d and in PH7d compared to 2D according to IPA; the interferon pathway with arrows pointing to the top five changing genes in PH4d is shown in Table 2. Genes in red were upregulated in PH4d. Two hundred of the most up- and downregulated genes in PH4d/PH7d compared to the 2D cultures were subjected to IPA analysis. B. The gene expression results were validated by measuring interferon-alpha and beta activity from JIMT1 cells by transfecting them with a Cignal ISRE Reporter dual-luciferase assay kit (Qiagen). The kit measures induction of the STAT1 and STAT2 components of the JAK/STAT-signal transduction pathways as a readout for interferon activity. The cells were grown in 2D, MG, or PH for 3 days before reporter plasmids and transfection reagents were added for 24 hours. *** p-value < 0.001.

References

    1. Pampaloni F, Reynaud EG, Stelzer EH (2007) The third dimension bridges the gap between cell culture and live tissue. Nat Rev Mol Cell Biol 8: 839-845. doi: 10.1038/nrm2236. PubMed: 17684528. - DOI - PubMed
    1. Kenny PA, Lee GY, Myers CA, Neve RM, Semeiks JR et al. (2007) The morphologies of breast cancer cell lines in three-dimensional assays correlate with their profiles of gene expression. Mol Oncol 1: 84-96. doi: 10.1016/j.molonc.2007.02.004. PubMed: 18516279. - DOI - PMC - PubMed
    1. Wang F, Weaver VM, Petersen OW, Larabell CA, Dedhar S et al. (1998) Reciprocal interactions between beta1-integrin and epidermal growth factor receptor in three-dimensional basement membrane breast cultures: A different perspective in epithelial biology. Proc Natl Acad Sci U S A 95: 14821-14826. doi: 10.1073/pnas.95.25.14821. PubMed: 9843973. - DOI - PMC - PubMed
    1. Kim H, Phung Y, Ho M (2012) Changes in global gene expression associated with 3D structure of tumors: An ex vivo matrix-free mesothelioma spheroid model. PLOS ONE 7: e39556. doi: 10.1371/journal.pone.0039556. PubMed: 22737246. - DOI - PMC - PubMed
    1. Ghosh S, Spagnoli GC, Martin I, Ploegert S, Demougin P et al. (2005) Three-dimensional culture of melanoma cells profoundly affects gene expression profile: A high density oligonucleotide array study. J Cell Physiol 204: 522-531. doi: 10.1002/jcp.20320. PubMed: 15744745. - DOI - PubMed

Publication types