Acetylation of lysine 382 and phosphorylation of serine 392 in p53 modulate the interaction between p53 and MDC1 in vitro
- PMID: 24194938
- PMCID: PMC3806821
- DOI: 10.1371/journal.pone.0078472
Acetylation of lysine 382 and phosphorylation of serine 392 in p53 modulate the interaction between p53 and MDC1 in vitro
Abstract
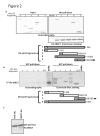
Occurrence of DNA damage in a cell activates the DNA damage response, a survival mechanism that ensures genomics stability. Two key members of the DNA damage response are the tumor suppressor p53, which is the most frequently mutated gene in cancers, and MDC1, which is a central adaptor that recruits many proteins to sites of DNA damage. Here we characterize the in vitro interaction between p53 and MDC1 and demonstrate that p53 and MDC1 directly interact. The p53-MDC1 interaction is mediated by the tandem BRCT domain of MDC1 and the C-terminal domain of p53. We further show that both acetylation of lysine 382 and phosphorylation of serine 392 in p53 enhance the interaction between p53 and MDC1. Additionally, we demonstrate that the p53-MDC1 interaction is augmented upon the induction of DNA damage in human cells. Our data suggests a new role for acetylation of lysine 382 and phosphorylation of serine 392 in p53 in the cellular stress response and offers the first evidence for an interaction involving MDC1 that is modulated by acetylation.
Conflict of interest statement
Figures


Similar articles
-
MDC1 is ubiquitylated on its tandem BRCT domain and directly binds RAP80 in a UBC13-dependent manner.DNA Repair (Amst). 2011 Aug 15;10(8):806-14. doi: 10.1016/j.dnarep.2011.04.016. Epub 2011 May 31. DNA Repair (Amst). 2011. PMID: 21622030
-
The direct interaction between 53BP1 and MDC1 is required for the recruitment of 53BP1 to sites of damage.J Biol Chem. 2009 Jan 2;284(1):426-435. doi: 10.1074/jbc.M807375200. Epub 2008 Nov 5. J Biol Chem. 2009. PMID: 18986980
-
Structure of a second BRCT domain identified in the nijmegen breakage syndrome protein Nbs1 and its function in an MDC1-dependent localization of Nbs1 to DNA damage sites.J Mol Biol. 2008 Aug 29;381(2):361-72. doi: 10.1016/j.jmb.2008.05.087. Epub 2008 Jun 14. J Mol Biol. 2008. PMID: 18582474 Free PMC article.
-
p300/CBP/p53 interaction and regulation of the p53 response.Eur J Biochem. 2001 May;268(10):2773-8. doi: 10.1046/j.1432-1327.2001.02226.x. Eur J Biochem. 2001. PMID: 11358491 Review.
-
The ARF/oncogene pathway activates p53 acetylation within the DNA binding domain.Cell Cycle. 2007 Jun 1;6(11):1304-6. doi: 10.4161/cc.6.11.4343. Epub 2007 Jun 24. Cell Cycle. 2007. PMID: 17534149 Review.
Cited by
-
Exploring Somatic Alteration Associating With Aggressive Behaviors of Papillary Thyroid Carcinomas by Targeted Sequencing.Front Oncol. 2021 Oct 7;11:722814. doi: 10.3389/fonc.2021.722814. eCollection 2021. Front Oncol. 2021. PMID: 34692499 Free PMC article.
-
Post-Translational Modifications by Lipid Metabolites during the DNA Damage Response and Their Role in Cancer.Biomolecules. 2022 Nov 8;12(11):1655. doi: 10.3390/biom12111655. Biomolecules. 2022. PMID: 36359005 Free PMC article. Review.
-
Roles for MDC1 in cancer development and treatment.DNA Repair (Amst). 2020 Nov;95:102948. doi: 10.1016/j.dnarep.2020.102948. Epub 2020 Aug 11. DNA Repair (Amst). 2020. PMID: 32866776 Free PMC article. Review.
-
VCP maintains nuclear size by regulating the DNA damage-associated MDC1-p53-autophagy axis in Drosophila.Nat Commun. 2021 Jul 12;12(1):4258. doi: 10.1038/s41467-021-24556-0. Nat Commun. 2021. PMID: 34253734 Free PMC article.
-
The deubiquitinase inhibitor WP1130 drives nuclear aggregation and reactivation of mutant p53 for selective cancer cell targeting.FEBS J. 2025 Jun;292(11):2823-2842. doi: 10.1111/febs.70036. Epub 2025 Mar 11. FEBS J. 2025. PMID: 40070163 Free PMC article.
References
Publication types
MeSH terms
Substances
LinkOut - more resources
Full Text Sources
Other Literature Sources
Molecular Biology Databases
Research Materials
Miscellaneous

