

Internal water and microsecond dynamics in myoglobin
- PMID: 24195787
- PMCID: PMC3966298
- DOI: 10.1021/jp409234g
Internal water and microsecond dynamics in myoglobin
Abstract
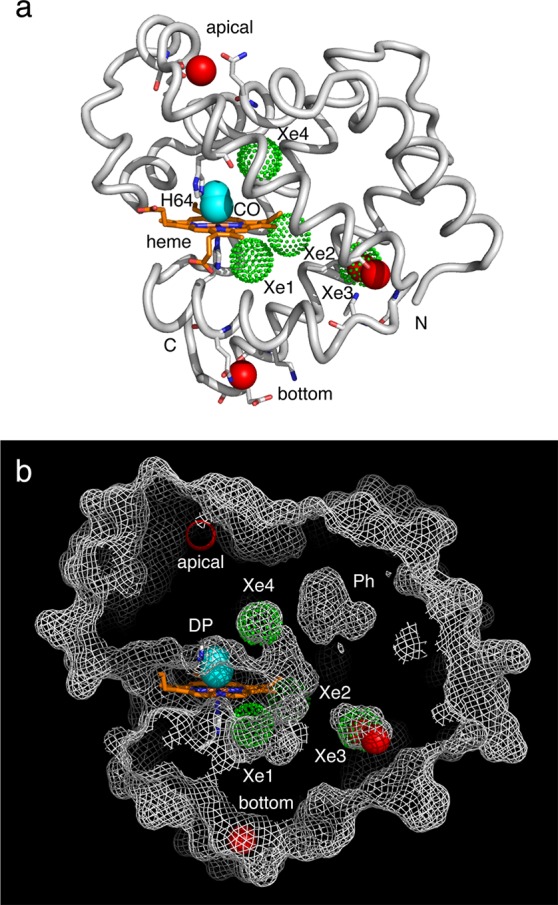
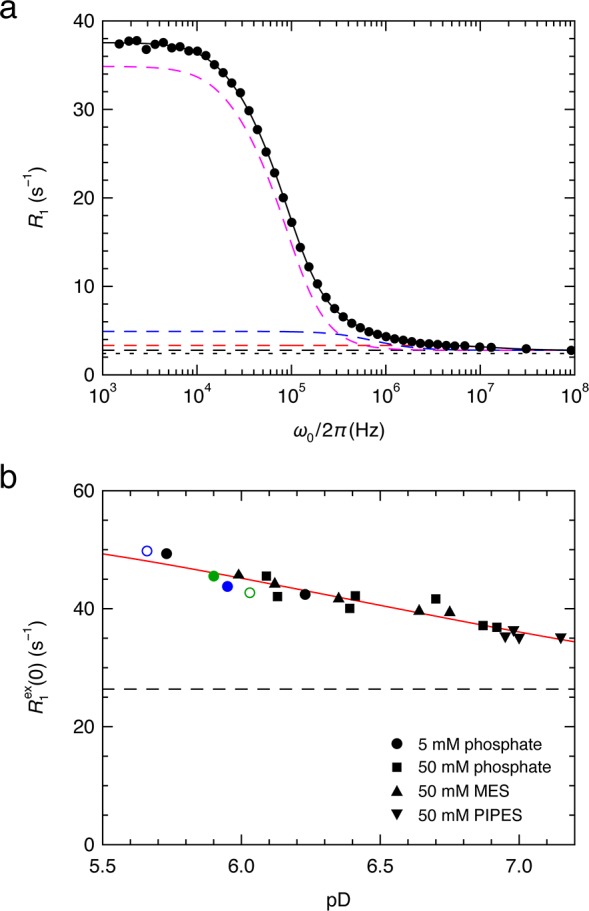
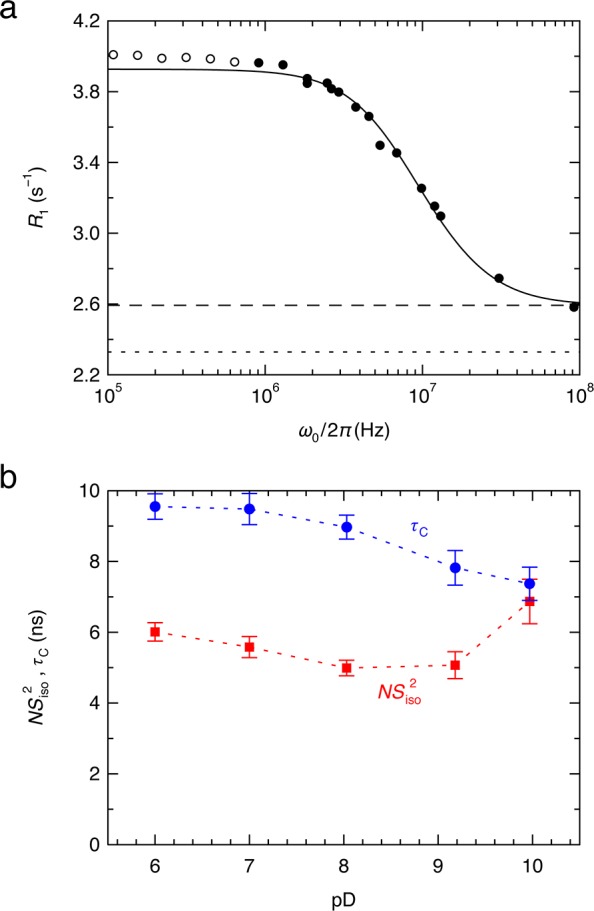
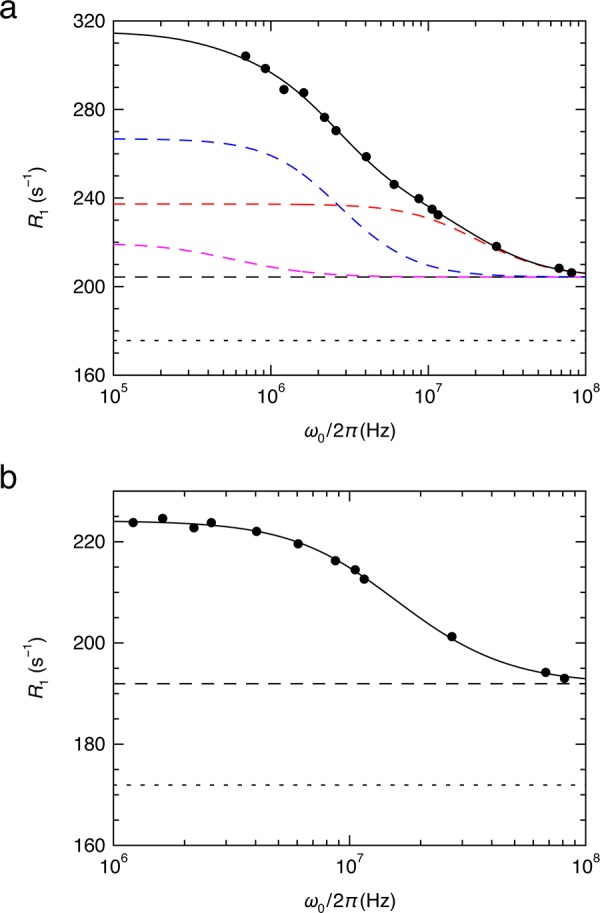
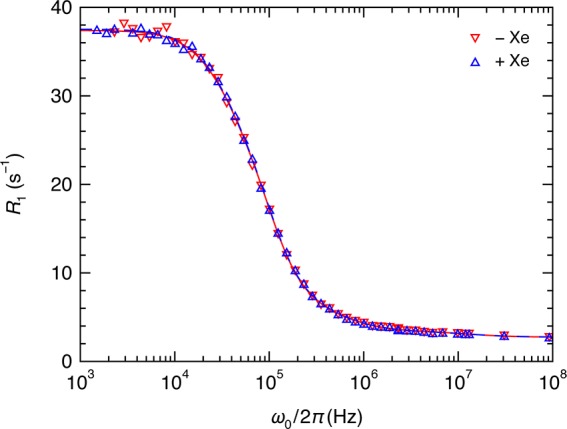
Myoglobin (Mb) binds diatomic ligands, like O2, CO, and NO, in a cavity that is only transiently accessible. Crystallography and molecular simulations show that the ligands can migrate through an extensive network of transiently connected cavities but disagree on the locations and occupancy of internal hydration sites. Here, we use water (2)H and (17)O magnetic relaxation dispersion (MRD) to characterize the internal water molecules in Mb under physiological conditions. We find that equine carbonmonoxy Mb contains 4.5 ± 1.0 ordered internal water molecules with a mean survival time of 5.6 ± 0.5 μs at 25 °C. The likely locations of these water molecules are the four polar hydration sites, including one of the xenon-binding cavities, that are fully occupied in all high-resolution crystal structures of equine Mb. The finding that water escapes from these sites, located 17-31 Å apart in the protein, on the same μs time scale suggests a global exchange mechanism. We propose that this mechanism involves transient penetration of the protein by H-bonded water chains. Such a mechanism could play a functional role by eliminating trapped ligands. In addition, the MRD results indicate that 2 or 3 of the 11 histidine residues of equine Mb undergo intramolecular hydrogen exchange on a μs time scale.
Figures
Similar articles
-
Structural dynamics of ligand diffusion in the protein matrix: A study on a new myoglobin mutant Y(B10) Q(E7) R(E10).Biophys J. 1999 Mar;76(3):1259-69. doi: 10.1016/S0006-3495(99)77289-9. Biophys J. 1999. PMID: 10049310 Free PMC article.
-
Cavities and packing defects in the structural dynamics of myoglobin.EMBO Rep. 2001 Aug;2(8):674-9. doi: 10.1093/embo-reports/kve159. EMBO Rep. 2001. PMID: 11493595 Free PMC article.
-
Visualizing breathing motion of internal cavities in concert with ligand migration in myoglobin.Proc Natl Acad Sci U S A. 2009 Feb 24;106(8):2612-6. doi: 10.1073/pnas.0807774106. Epub 2009 Feb 9. Proc Natl Acad Sci U S A. 2009. PMID: 19204297 Free PMC article.
-
Ligand pathways in myoglobin: a review of Trp cavity mutations.IUBMB Life. 2007 Aug-Sep;59(8-9):552-62. doi: 10.1080/15216540701230495. IUBMB Life. 2007. PMID: 17701550 Review.
-
Structural dynamics of myoglobin.Biophys Chem. 2000 Aug 30;86(2-3):221-30. doi: 10.1016/s0301-4622(00)00142-3. Biophys Chem. 2000. PMID: 11026686 Review.
Cited by
-
Water as an Intrinsic Structural Element in Cellulose Fibril Aggregates.J Phys Chem Lett. 2022 Jun 23;13(24):5424-5430. doi: 10.1021/acs.jpclett.2c00781. Epub 2022 Jun 9. J Phys Chem Lett. 2022. PMID: 35679323 Free PMC article.
-
Perspective: Structure and ultrafast dynamics of biomolecular hydration shells.Struct Dyn. 2017 Apr 20;4(4):044018. doi: 10.1063/1.4981019. eCollection 2017 Jul. Struct Dyn. 2017. PMID: 28470026 Free PMC article.
-
Water Dynamics in the Hydration Shells of Biomolecules.Chem Rev. 2017 Aug 23;117(16):10694-10725. doi: 10.1021/acs.chemrev.6b00765. Epub 2017 Mar 1. Chem Rev. 2017. PMID: 28248491 Free PMC article. Review.
-
Terahertz spectroscopy as a method for investigation of hydration shells of biomolecules.Biophys Rev. 2023 Sep 7;15(5):833-849. doi: 10.1007/s12551-023-01131-z. eCollection 2023 Oct. Biophys Rev. 2023. PMID: 37974994 Free PMC article. Review.
-
Effect of Exchange Dynamics on the NMR Relaxation of Water in Porous Silica.J Phys Chem Lett. 2024 Nov 14;15(45):11335-11341. doi: 10.1021/acs.jpclett.4c02590. Epub 2024 Nov 5. J Phys Chem Lett. 2024. PMID: 39499855 Free PMC article.
References
-
- Wittenberg J. B.; Wittenberg B. A. Myoglobin Function Reassessed. J. Exp. Biol. 2003, 206, 2011–2020. - PubMed
-
- Kendrew J. C.; Bodo G.; Dintzis H. M.; Parrish R. G.; Wyckoff H.; Phillips D. C. A Three-Dimensional Model of the Myoglobin Molecule Obtained by X-ray Analysis. Nature 1958, 181, 662–666. - PubMed
-
- Maurus R.; Overall C. M.; Bogumil R.; Luo Y.; Mauk A. G.; Smith M.; Brayer G. D. A Myoglobin Variant with a Polar Substitution in a Conserved Hydrophobic Bluster in the Heme Binding Pocket. Biochim. Biophys. Acta 1997, 1341, 1–13. - PubMed
-
- Kachalova G. S.; Popov A. N.; Bartunik H. D. A Steric Mechanism for Inhibition of CO Binding to Heme Proteins. Science 1999, 284, 473–476. - PubMed
Publication types
MeSH terms
Substances
LinkOut - more resources
Full Text Sources
Other Literature Sources
Miscellaneous
