

Top-down controls on bacterial community structure: microbial network analysis of bacteria, T4-like viruses and protists
- PMID: 24196323
- PMCID: PMC3960540
- DOI: 10.1038/ismej.2013.199
Top-down controls on bacterial community structure: microbial network analysis of bacteria, T4-like viruses and protists
Abstract
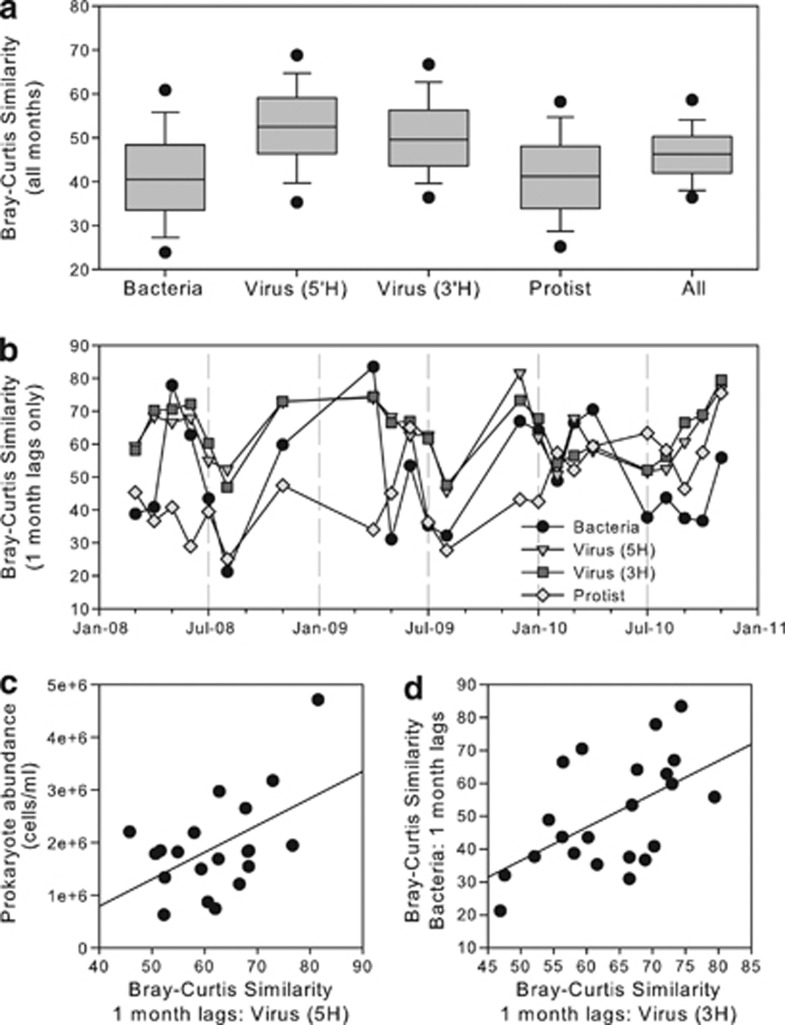
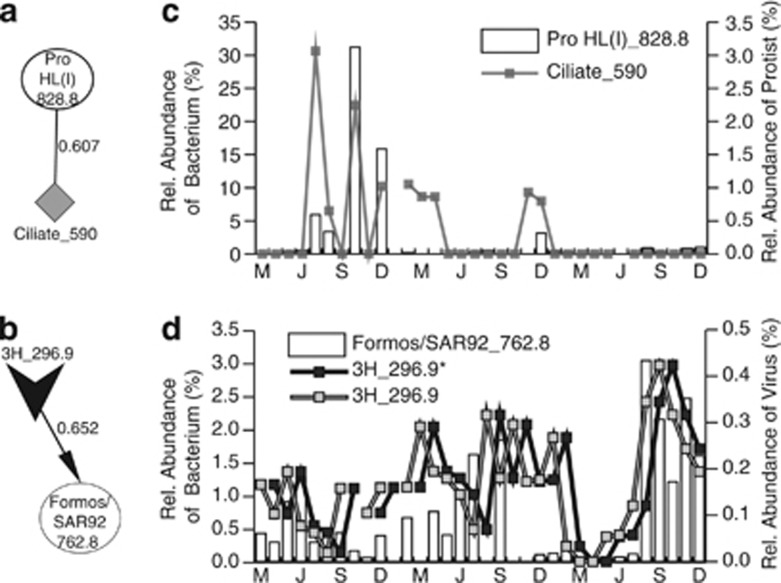
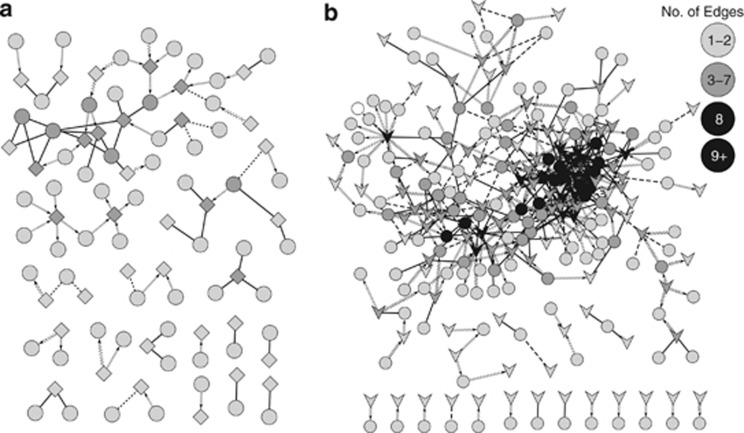
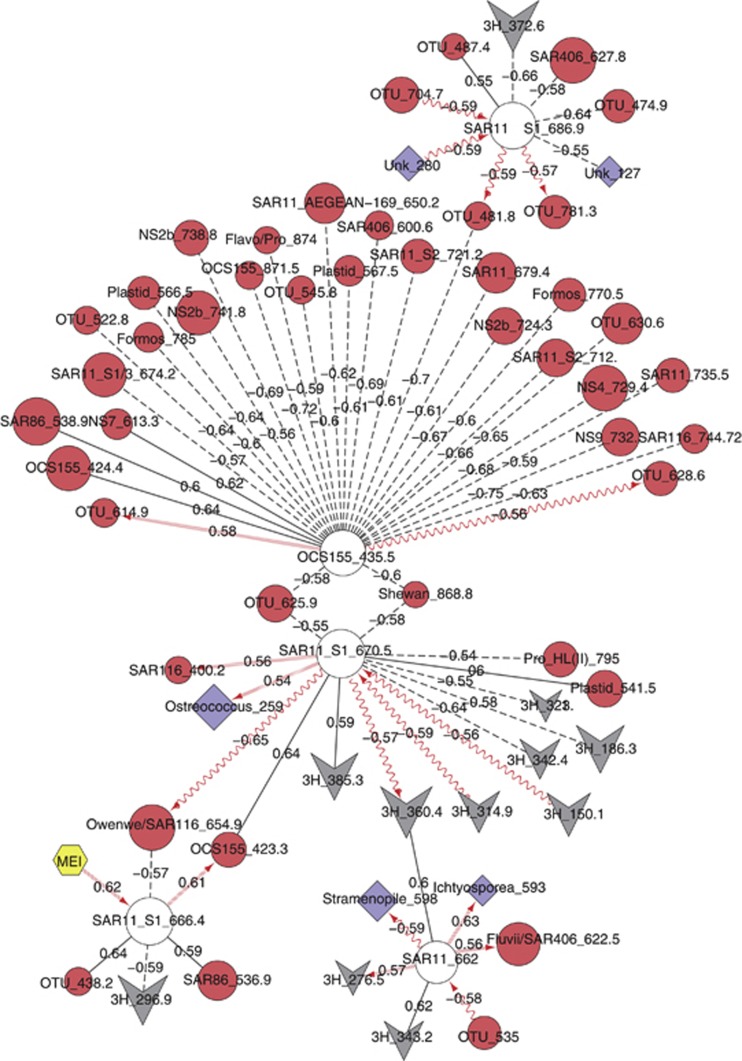
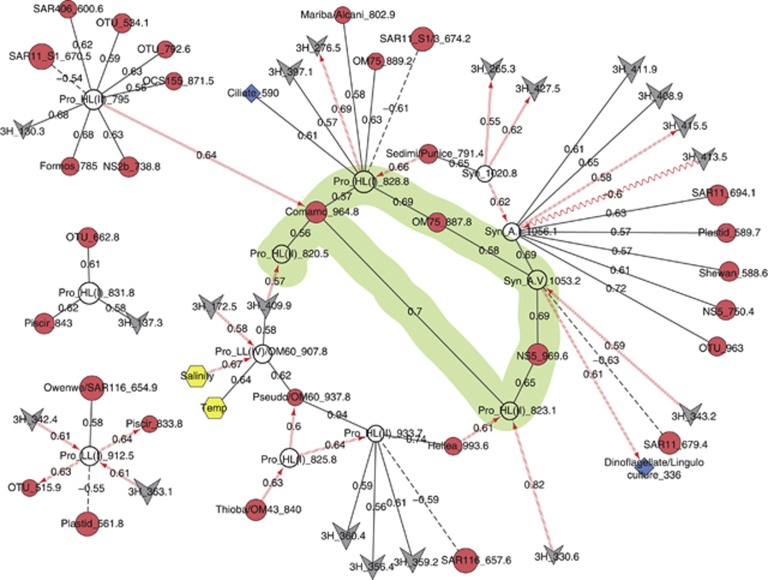
Characterizing ecological relationships between viruses, bacteria and protists in the ocean are critical to understanding ecosystem function, yet these relationships are infrequently investigated together. We evaluated these relationships through microbial association network analysis of samples collected approximately monthly from March 2008 to January 2011 in the surface ocean (0-5 m) at the San Pedro Ocean Time series station. Bacterial, T4-like myoviral and protistan communities were described by Automated Ribosomal Intergenic Spacer Analysis and terminal restriction fragment length polymorphism of the gene encoding the major capsid protein (g23) and 18S ribosomal DNA, respectively. Concurrent shifts in community structure suggested similar timing of responses to environmental and biological parameters. We linked T4-like myoviral, bacterial and protistan operational taxonomic units by local similarity correlations, which were then visualized as association networks. Network links (correlations) potentially represent synergistic and antagonistic relationships such as viral lysis, grazing, competition or other interactions. We found that virus-bacteria relationships were more cross-linked than protist-bacteria relationships, suggestive of increased taxonomic specificity in virus-bacteria relationships. We also found that 80% of bacterial-protist and 74% of bacterial-viral correlations were positive, with the latter suggesting that at monthly and seasonal timescales, viruses may be following their hosts more often than controlling host abundance.
Figures
Similar articles
-
With a little help from my friends: importance of protist-protist interactions in structuring marine protistan communities in the San Pedro Channel.mSystems. 2025 Feb 18;10(2):e0104524. doi: 10.1128/msystems.01045-24. Epub 2025 Jan 29. mSystems. 2025. PMID: 39878540 Free PMC article.
-
Short-term observations of marine bacterial and viral communities: patterns, connections and resilience.ISME J. 2013 Jul;7(7):1274-85. doi: 10.1038/ismej.2013.19. Epub 2013 Feb 28. ISME J. 2013. PMID: 23446831 Free PMC article.
-
Impact of protists on the activity and structure of the bacterial community in a rice field soil.Appl Environ Microbiol. 2006 Aug;72(8):5436-44. doi: 10.1128/AEM.00207-06. Appl Environ Microbiol. 2006. PMID: 16885296 Free PMC article.
-
Predation as a shaping force for the phenotypic and genotypic composition of planktonic bacteria.Antonie Van Leeuwenhoek. 2002 Aug;81(1-4):413-34. doi: 10.1023/a:1020505204959. Antonie Van Leeuwenhoek. 2002. PMID: 12448740 Review.
-
Significance of predation by protists in aquatic microbial food webs.Antonie Van Leeuwenhoek. 2002 Aug;81(1-4):293-308. doi: 10.1023/a:1020591307260. Antonie Van Leeuwenhoek. 2002. PMID: 12448728 Review.
Cited by
-
Distribution of Dimethylsulfoniopropionate Degradation Genes Reflects Strong Water Current Dependencies in the Sanriku Coastal Region in Japan: From Mesocosm to Field Study.Front Microbiol. 2020 Jul 13;11:1372. doi: 10.3389/fmicb.2020.01372. eCollection 2020. Front Microbiol. 2020. PMID: 32754122 Free PMC article.
-
An Exploratory Study on the Microbiome of Northern and Southern Populations of Ixodes scapularis Ticks Predicts Changes and Unique Bacterial Interactions.Pathogens. 2022 Jan 21;11(2):130. doi: 10.3390/pathogens11020130. Pathogens. 2022. PMID: 35215074 Free PMC article.
-
Conceptual strategies for characterizing interactions in microbial communities.iScience. 2022 Jan 15;25(2):103775. doi: 10.1016/j.isci.2022.103775. eCollection 2022 Feb 18. iScience. 2022. PMID: 35146390 Free PMC article. Review.
-
A subset of viruses thrives following microbial resuscitation during rewetting of a seasonally dry California grassland soil.Nat Commun. 2023 Sep 20;14(1):5835. doi: 10.1038/s41467-023-40835-4. Nat Commun. 2023. PMID: 37730729 Free PMC article.
-
Microbial micropatches within microbial hotspots.PLoS One. 2018 May 22;13(5):e0197224. doi: 10.1371/journal.pone.0197224. eCollection 2018. PLoS One. 2018. PMID: 29787564 Free PMC article.
References
-
- Assenov Y, Ramírez F, Schelhorn S, Lengauer T, Albrecht M. Computing topological parameters of biological networks. Bioinformatics. 2008;24:282–284. - PubMed
-
- Azam F, Fenchel T, Field J, Gray J, Meyer-Reil L, Thingstad F. The ecological role of water-column microbes in the sea. Mar Ecol Prog Ser. 1983;10:257–263.
-
- Baudoux A, Veldhuis M. Estimates of virus-vs grazing induced mortality of picophytoplankton in the North Sea during summer. Aquat Microb Ecol. 2008;52:69–82.
-
- Bouvier T, del Giorgio PA. Key role of selective viral-induced mortality in determining marine bacterial community composition. Environ Microbiol. 2007;9:287–297. - PubMed
-
- Bouvy M, Bettarel Y, Bouvier C, Domaizon I, Jacquet S, Le Floc'h E, et al. Trophic interactions between viruses, bacteria and nanoflagellates under various nutrient conditions and simulated climate change. Environ Microbiol. 2011;13:1842–1857. - PubMed
Publication types
MeSH terms
Substances
LinkOut - more resources
Full Text Sources
Other Literature Sources
