. 2014 Jan;7(1):54-64.
doi: 10.1158/1940-6207.CAPR-13-0110. Epub 2013 Nov 6.

Metformin inhibits skin tumor promotion in overweight and obese mice

Affiliations

Metformin inhibits skin tumor promotion in overweight and obese mice

L Allyson Checkley et al. Cancer Prev Res (Phila). 2014 Jan.

Abstract

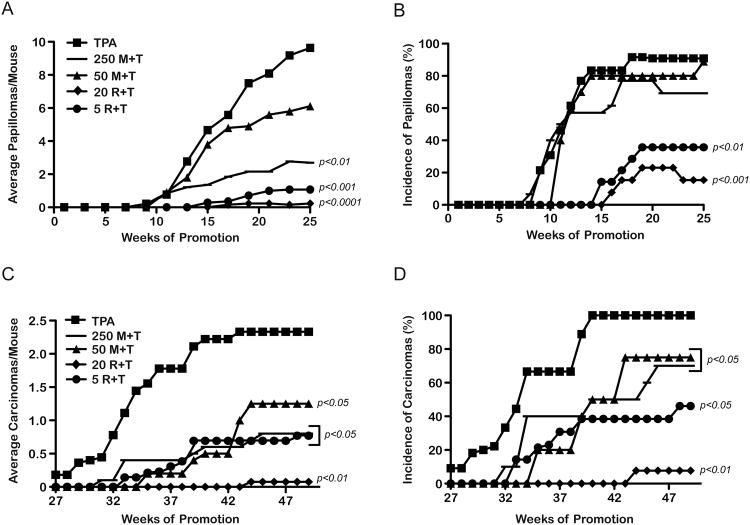
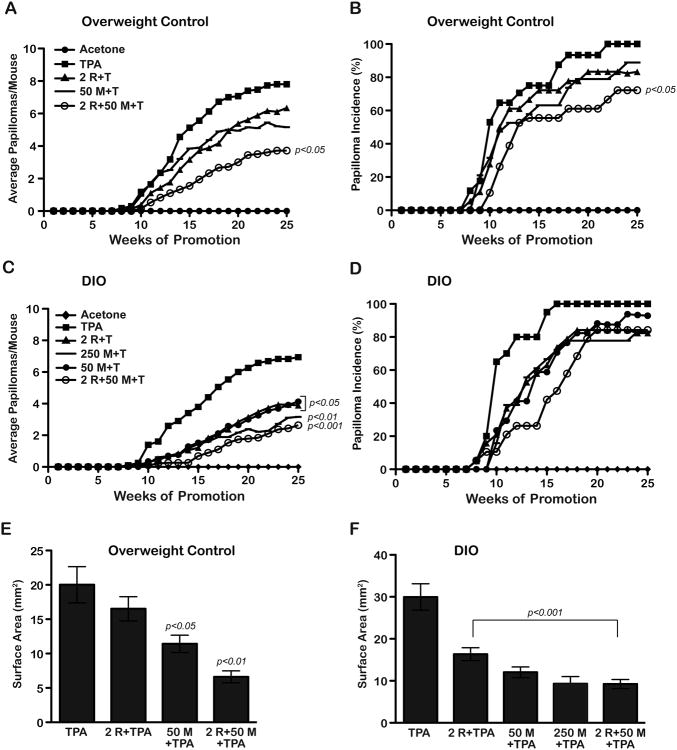
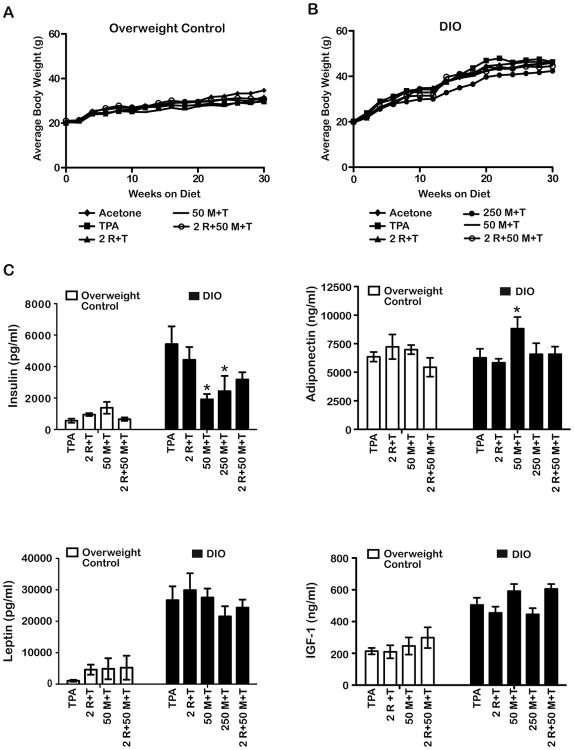
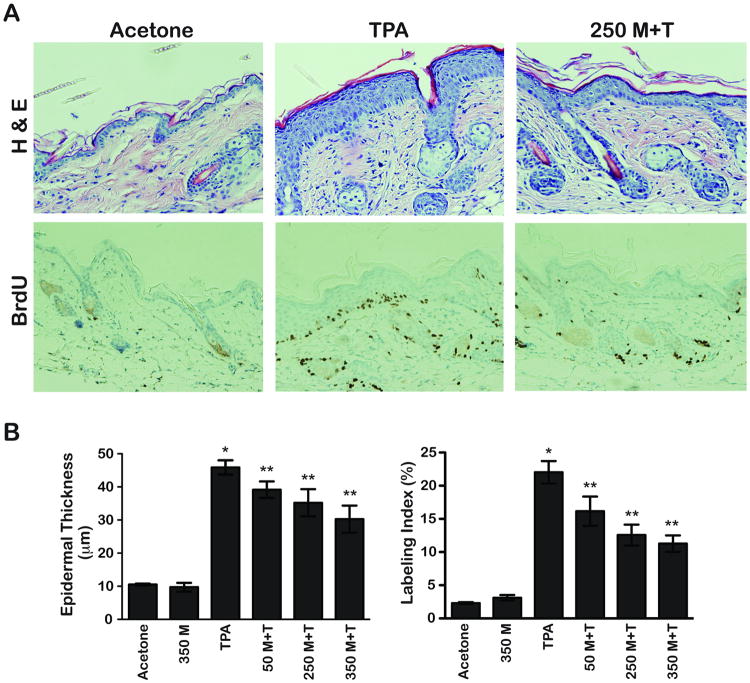
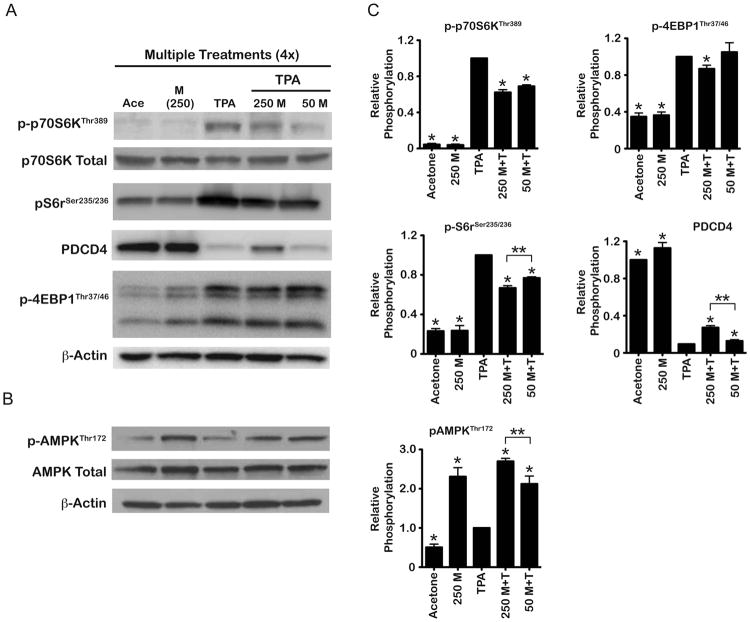
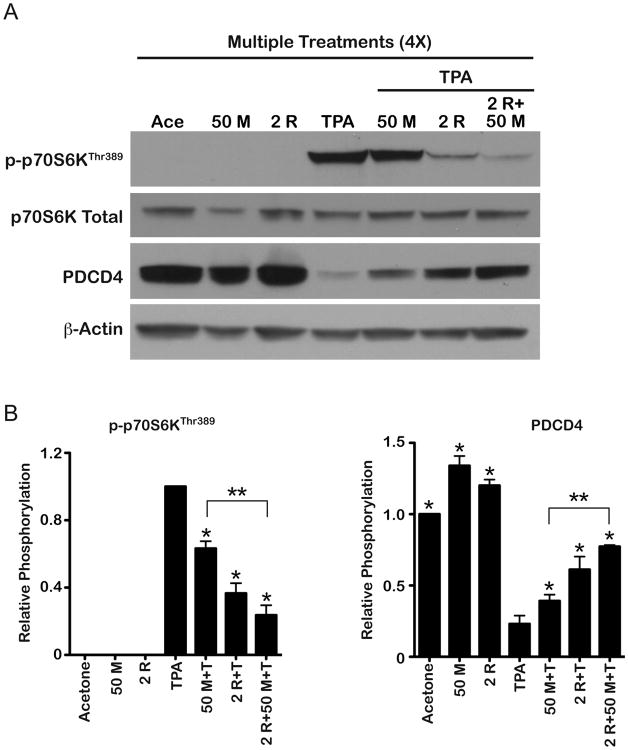
In the present study, the ability of metformin to inhibit skin tumor promotion by 12-O-tetradecanoylphorbol-13-acetate (TPA) was analyzed in mice maintained on either an overweight control diet or an obesity-inducing diet. Rapamycin was included for comparison, and a combination of metformin and rapamycin was also evaluated. Metformin (given in the drinking water) and rapamycin (given topically) inhibited development of both papillomas and squamous cell carcinomas in overweight and obese mice in a dose-dependent manner. A low-dose combination of these two compounds displayed an additive inhibitory effect on tumor development. Metformin treatment also reduced the size of papillomas. Interestingly, all treatments seemed to be at least as effective for inhibiting tumor formation in obese mice, and both metformin and rapamycin were more effective at reducing tumor size in obese mice compared with overweight control mice. The effect of metformin on skin tumor development was associated with a significant reduction in TPA-induced epidermal hyperproliferation. Furthermore, treatment with metformin led to activation of epidermal AMP-activated protein kinase (AMPK) and attenuated signaling through mTOR complex (mTORC)-1 and p70S6K. Combinations of metformin and rapamycin were more effective at blocking epidermal mTORC1 signaling induced by TPA consistent with the greater inhibitory effect on skin tumor promotion. Collectively, the current data demonstrate that metformin given in the drinking water effectively inhibited skin tumor promotion in both overweight and obese mice and that the mechanism involves activation of epidermal AMPK and attenuated signaling downstream of mTORC1.


Figures

Figure 1
Figure 1
Effect of metformin on tumor development and progression. Two-stage skin carcinogenesis studies were conducted using mice fed the 10 Kcal% fat diet (AIN76A; overweight control diet). A, At 25 weeks, the tumor multiplicity in the 250 mg/kg (−) BW/day metformin+TPA treated groups and the 5 nmol (●) and 20 nmol (◆) rapamycin+TPA treated groups was significantly lower than the 6.8 nmol TPA (■) control group (Mann-Whitney U-test). B, The 5 nmol (●) and 20 nmol (◆) rapamycin+TPA treated groups had a significantly reduced papilloma incidence compared to the 6.8 nmol TPA (■) group (Fisher's exact test). C, Both doses of metformin and rapamycin significantly reduced the average number of carcinomas/mouse compared to the TPA control group (Mann-Whitney U-test). D, All treatments significantly reduced the incidence of carcinomas (Fisher's exact test).
Figure 2
Figure 2
Effect of metformin alone and in combination with rapamycin on tumor promotion in overweight control and obese mice. Two-stage skin carcinogenesis studies were conducted using mice on an overweight control (10 Kcal% fat) diet (A, B) or an obese (Diet-induced obesity, DIO, 60 Kcal% fat) diet (C, D). Papilloma number and incidence were recorded weekly. Tumor surface area was determined from a subset of tumors from each treatment group after 23 weeks of promotion. A, The combination treatment group (○) (2 nmol rapamycin, 50 mg/kg metformin+TPA) had significantly reduced tumor multiplicity at 25 weeks, (Mann-Whitney U - test). B, The combination treatment group (○) had a significant reduction in tumor incidence (Fisher's exact test). C, All treatment groups had significantly reduced tumor multiplicity (Mann- Whitney U-test). D, No differences were observed in tumor incidence in any treatment group (Fisher's exact test). E, Graphs represent the average surface area ± SEM in overweight control mice. The 50 mg/kg metformin+TPA group and the combination treatment group displayed a significant reduction in tumor size compared to the TPA control group (Mann- Whitney U-test). F, Graphs represent the average surface area ± SEM in obese mice. All treatment groups had statistically significant decreases in skin tumor size compared to the TPA control group (Mann-Whitney U-test).
Figure 3
Figure 3
Influence of metformin and diet on body weight (BW) and serum hormones. Mice undergoing the carcinogenesis protocol described in Figure 2 were weighed every two weeks once groups were switched to either the 10 Kcal% fat (overweight control) or 60 Kcal% fat (Diet- induced obesity, DIO) diet. Serum was collected at the end of the 25-week promotion period (30 weeks total on the different diets). A, Treatment with metformin, rapamycin, or combinations of these compounds prior to TPA had no significant effect on BW gain in the overweight control groups. B, None of the treatment regimens affected weight gain in the obese groups compared to the TPA only group. The differences in average BW between the overweight control and DIO diet groups (including all treatment groups combined) were statistically significant (31.6 ± 0.86 vs. 45.2 ± 0.63, respectively, p<0.05, Mann-Whitney U-test). C, Fasting serum levels (mean ± SEM) of insulin, adiponectin, leptin, and IGF-1 in overweight or obese mice receiving TPA, metformin+TPA, rapamycin+TPA, or metformin+rapamycin+TPA at the doses indicated (n=4-7). * Indicates significantly different from the TPA only group, (p<0.05; Mann-Whitney U-test).
Figure 4
Figure 4
Effect of metformin on TPA-induced epidermal hyperproliferation and hyperplasia. A, Representative H&E and BrdU stained sections of dorsal skin collected from female FVB/N mice (4/group) at 48h after the last of 4 treatments with either acetone or 6.8 nmol of TPA alone or with metformin in the drinking water (250 mg/kg BW/day). B, Quantitative evaluation (mean ± SEM) of the effects of metformin on TPA-induced epidermal hyperproliferation (labeling index) and hyperplasia (epidermal thickness). * Indicates significantly different from the acetone and metformin only (350 mg/kg) treatment groups (p<0.05, Mann-Whitney U-test). ** Significantly different from the TPA-treated group (p<0.05, Mann-Whitney U-test).
Figure 5
Figure 5
Effect of metformin on epidermal mTORC1 and AMPK in the absence or presence of TPA treatment. Pooled protein lysates were prepared from epidermal scrapings of FVB/N mice (n=5/group) undergoing a multiple treatment regimen of either acetone (vehicle), metformin alone (250 mg/kg), 6.8 nmol TPA alone, or metformin+TPA (50 or 250 mg/kg BW/day). A, Representative Western blot analyses of p-p70S6K, p-S6 ribosomal, PDCD4 and p-4EBP1. B, Representative Western blot analyses of epidermal p-AMPK. C, Quantification of Western blots from three independent experiments. Expression levels were normalized to β-actin and averaged. * Indicates significantly different from the TPA-treated group (p<0.05, Mann Whitney U-test). ** Indicates significantly different values between the indicated treatment groups (p<0.05, Mann Whitney U-test).
Figure 6
Figure 6
Effect of metformin or rapamycin alone and in combination on TPA-induced mTORC1 signaling. Pooled protein lysates were prepared from epidermal scrapings of FVB/N mice (n=5/group) undergoing a multiple treatment regimen of acetone, metformin alone (50 mg/kg), 6.8 nmol of TPA alone, 50 mg/kg metformin+TPA, 2 nmol of rapamycin+TPA, or combinations of these two treatments prior to TPA. A, Representative Western blot analyses of mTORC1 downstream targets p-p70S6K and PDCD4. B, Quantification of Western blots from three independent experiments. Expression levels were normalized to p-actin and averaged. * Indicates significantly different from the TPA-treated group (p<0.05, Mann Whitney U-test). **Indicates significantly different values between the indicated treatment groups (p<0.05, Mann Whitney U-test).

References

    1. Hundal RS, Krssak M, Dufour S, Laurent D, Lebon V, Chandramouli V, et al. Mechanism by which metformin reduces glucose production in type 2 diabetes. Diabetes. 2000;49:2063–9. - PMC - PubMed
    1. Decensi A, Puntoni M, Goodwin P, Cazzaniga M, Gennari A, Bonanni B, et al. Metformin and cancer risk in diabetic patients: a systematic review and meta-analysis. Cancer Prev Res (Phila) 2010;3:1451–61. - PubMed
    1. Evans JM, Donnelly LA, Emslie-Smith AM, Alessi DR, Morris AD. Metformin and reduced risk of cancer in diabetic patients. BMJ. 2005;330:1304–5. - PMC - PubMed
    1. Anisimov VN, Berstein LM, Egormin PA, Piskunova TS, Popovich IG, Zabezhinski MA, et al. Effect of metformin on life span and on the development of spontaneous mammary tumors in HER-2/neu transgenic mice. Exp Gerontol. 2005;40:685–93. - PubMed
    1. Tomimoto A, Endo H, Sugiyama M, Fujisawa T, Hosono K, Takahashi H, et al. Metformin suppresses intestinal polyp growth in ApcMin/+ mice. Cancer Sci. 2008;99:2136–41. - PMC - PubMed

Publication types

MeSH terms