. 2014 Jan;24(1):1-13.
doi: 10.1101/gr.164079.113. Epub 2013 Nov 6.

Combinatorial effects of multiple enhancer variants in linkage disequilibrium dictate levels of gene expression to confer susceptibility to common traits

Affiliations

Combinatorial effects of multiple enhancer variants in linkage disequilibrium dictate levels of gene expression to confer susceptibility to common traits

Olivia Corradin et al. Genome Res. 2014 Jan.

Abstract

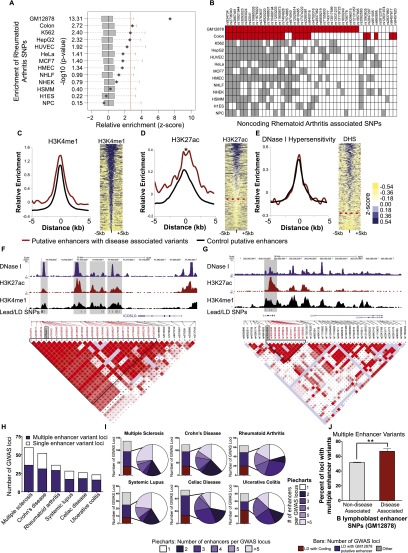
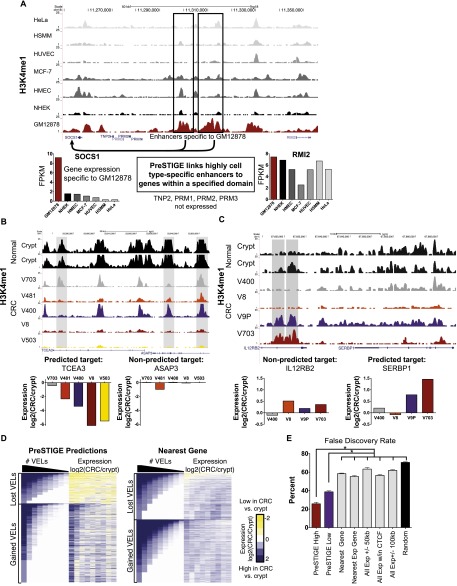
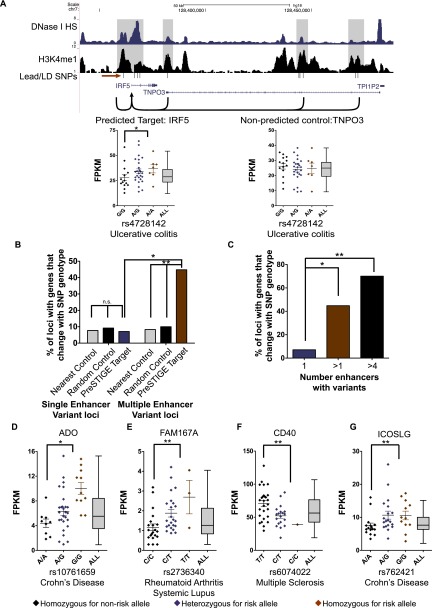
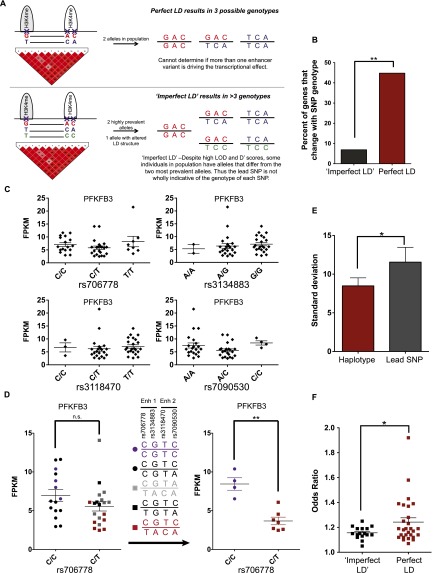
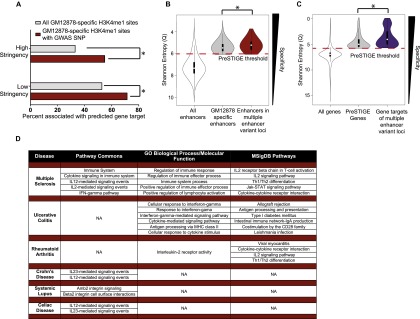
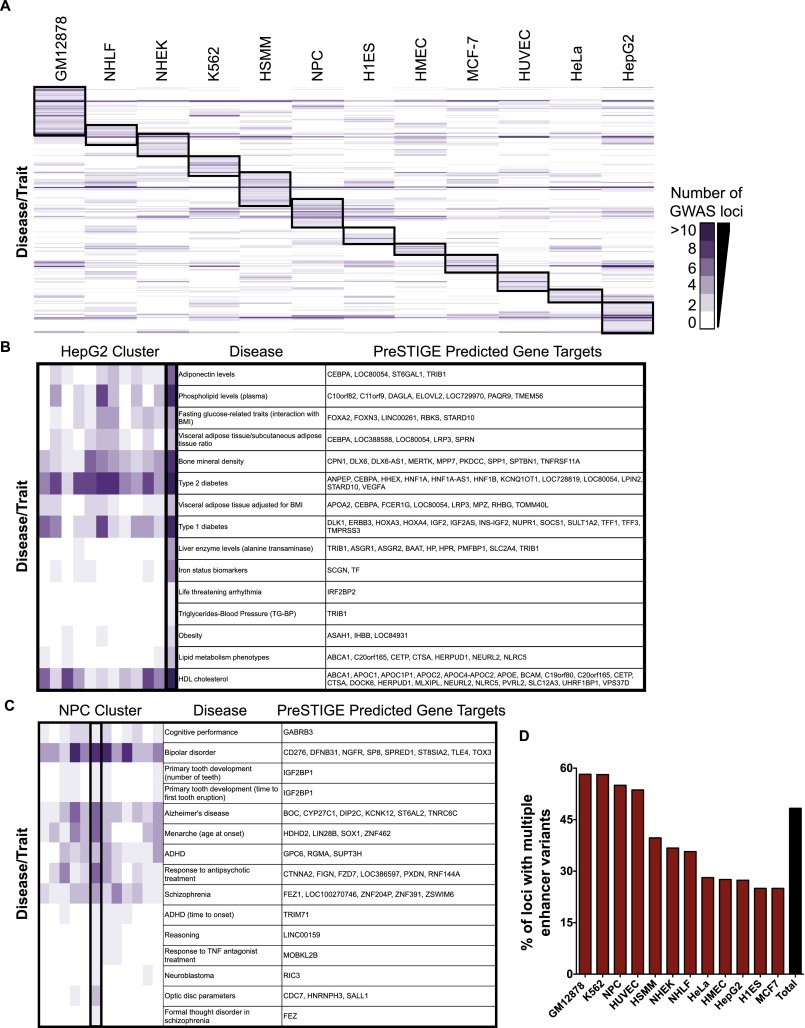
DNA variants (SNPs) that predispose to common traits often localize within noncoding regulatory elements such as enhancers. Moreover, loci identified by genome-wide association studies (GWAS) often contain multiple SNPs in linkage disequilibrium (LD), any of which may be causal. Thus, determining the effect of these multiple variant SNPs on target transcript levels has been a major challenge. Here, we provide evidence that for six common autoimmune disorders (rheumatoid arthritis, Crohn's disease, celiac disease, multiple sclerosis, lupus, and ulcerative colitis), the GWAS association arises from multiple polymorphisms in LD that map to clusters of enhancer elements active in the same cell type. This finding suggests a "multiple enhancer variant" hypothesis for common traits, where several variants in LD impact multiple enhancers and cooperatively affect gene expression. Using a novel method to delineate enhancer-gene interactions, we show that multiple enhancer variants within a given locus typically target the same gene. Using available data from HapMap and B lymphoblasts as a model system, we provide evidence at numerous loci that multiple enhancer variants cooperatively contribute to altered expression of their gene targets. The effects on target transcript levels tend to be modest and can be either gain- or loss-of-function. Additionally, the genes associated with multiple enhancer variants encode proteins that are often functionally related and enriched in common pathways. Overall, the multiple enhancer variant hypothesis offers a new paradigm by which noncoding variants can confer susceptibility to common traits.


Figures

Figure 1.
Figure 1.
Multiple enhancer variant loci associated with autoimmune diseases. (A) Variant Set Enrichment (VSE) analysis depicting enrichment of rheumatoid arthritis SNPs in putative enhancer elements in GM12878 cells. Boxplots represent the normalized null distribution generated using 1000 matched-random SNP sets. Diamonds correspond to the observed value relative to the null distribution. The red line denotes the threshold for significance, corrected for multiple testing. (B) Noncoding SNPs associated with rheumatoid arthritis. Shaded boxes denote instances where an H3K4me1 ChIP-seq peak detected in the indicated cell types overlaps either the GWAS lead SNP (listed to the right), or a SNP in LD with the lead SNP. The red boxes denote SNPs that drive the significant association with H3K4me1 sites in colon crypt and GM12878 cells. (C, left) Average H3K4me1 ChIP-seq signal at loci containing autoimmune disease-associated SNPs (red) and control H3K4me1 sites not associated with disease (black). (Right) H3K4me1 ChIP-seq signals at autoimmune disease-associated loci. Each row corresponds to an H3K4me1 site containing a SNP associated with any one of the six autoimmune diseases. (D) Same as C for H3K27ac. The dashed red line corresponds to the threshold of H3K27ac enrichment. (*) P < 0.004, Wilcoxon test (paired samples). (E) Same as C for DNase I hypersensitivity. The dashed red line corresponds to the threshold of DNase I HS. (F) Example of multiple enhancer variant locus associated with Crohn's disease. SNPs in LD with the lead SNP (rs762421) fall within multiple putative enhancer sites (gray boxes) enriched for H3K4me1 (black), DHS (purple), and H3K27ac (red). (G) Example of single enhancer variant locus associated with ulcerative colitis and Crohn's disease. Lead SNP (rs3024505) and LD SNPs fall in one enhancer (gray box). (H) Number of multiple enhancer variant loci and single enhancer variant loci detected for each of the six autoimmune traits. For example, for RA, 29 loci show evidence of multiple enhancer involvement, while seven show evidence of single enhancer involvement. (I) Bars display the number of GWAS loci in which the lead or LD SNP falls within coding regions (red), GM12878 putative enhancer elements (purple), and other (gray). Piecharts display the number of enhancers containing SNPs for each GWAS locus. (J) Percent of loci associated with all six autoimmune diseases showing evidence of multiple enhancer involvement in B lymphoblasts (red), compared with loci not known to be associated with a disease (gray). (**) P < 0.0001, by Fisher's exact test.
Figure 2.
Figure 2.
PreSTIGE methodology and FDR. (A) PreSTIGE links cell type-specific enhancers to genes specifically expressed in the same cell type. GM12878-specific H3K4me1 sites outlined in black are predicted to interact with the SOCS1 promoter, and not the RMI2 promoter. Levels of SOCS1 and RMI2 transcripts quantified by RNA-seq in each cell type. (FPKM) Fragments per kilobase of transcript per million fragments mapped. (B) UCSC Genome Browser image of putative enhancers lost in CRC (lost VELs) relative to normal colon crypts. The three H3K4me1 sites highlighted in gray are predicted to target TCEA3 in the colon crypts. Gene expression in the colon cancer cell lines relative to the colon crypt for the predicted target, TCEA3, and nonpredicted control gene, ASAP3. Note that TCEA3 levels are reduced in CRC lines containing lost VELs while ASAP3 is unaffected. (C) UCSC Genome Browser image of a representative gained enhancer locus (gained VEL). The H3K4me1 sites highlighted in gray are predicted to target SERBP1 in CRC lines V9P and V703. Gene expression in the colon cancer cell lines relative to the colon crypt for the predicted target SERBP1 and nonpredicted control gene IL12RB2. Note that SERBP1 expression is elevated in lines containing gained VELs while IL12RB2 is unaffected. (D) Heatmap showing overall correlation between VELs and gene expression. The left side of the heatmap corresponds to the number of lost (top) or gained (bottom) VELs associated with each gene (rows) in each of the nine CRC cell lines (columns). Dark blue denotes multiple VELs, whereas white indicates no VEL. The right side of the heatmap is ordered identically to the left side, and illustrates the change in expression (CRC/crypt) of the genes associated with the VELs by PreSTIGE (left) and the nearest gene to the VEL (right). (E) Approximation of PreSTIGE FDR (mean ± SEM) based on colon cancer VEL data compared with five commonly used computational methods. (*) P < 0.003, by paired t-test.
Figure 3.
Figure 3.
Impact of multiple enhancer variants on gene expression. (A) UCSC Genome Browser image of multiple enhancer variant locus associated with ulcerative colitis. Red arrow indicates lead SNP (rs4728142). FPKMs (fragments per kilobase per million reads) of the predicted target transcript IRF5 and nonpredicted transcript TNPO3 based on SNP genotype at the ulcerative colitis locus are shown (bottom). Gray Tukey plots display the normal range of expression for each gene. (B) Percent of GWAS loci with transcripts that show differential gene expression based on SNP genotype at single (left) and multiple (right) enhancer variant loci. Enhancer SNPs linked to a gene target using PreSTIGE are shown in purple and red. Controls include the expressed gene nearest the SNP that is not a PreSTIGE-predicted target (gray) and a randomly selected expressed gene (within 500 kb) that is not a PreSTIGE-predicted target (black) (Fisher's exact test). (C) Percent of GWAS loci associated with differential gene expression for single enhancer variant loci (purple) versus all multiple enhancer variant loci (red) and loci with more than four enhancers with variants (black) (Fisher's exact test). (D–G) Expression of transcripts in B-lymphoblasts derived from individuals carrying the risk allele compared with those homozygous for the nonrisk allele for four representative loci. Gray Tukey plots display the normal range of expression for each gene. “rs” numbers correspond to the lead SNPs at each GWAS locus (Mann-Whitney-Wilcoxon test). (*) P < 0.02, (**) P < 0.007, (***) P < 0.0001.
Figure 4.
Figure 4.
Effect of individual SNPs in multiple enhancer variant loci. (A) Schematic describing “imperfect LD” loci. When SNPs are in perfect LD, the lead GWAS SNP is indicative of the genotype of the entire allele and the locus includes only two haplotypes (red and purple) and three possible genotypes (red/red, red/purple, purple/purple). For loci with “imperfect LD” the lead SNP does not predict the genotype of remaining SNPs. This results in more than two haplotypes and more than three genotypes. (B) Percent of GWAS loci associated with transcripts that show differential gene expression based on SNP genotype for multiple enhancer variant loci in sites of “imperfect LD” (black) and perfect LD (red), Fisher's exact test. (C) Expression of predicted gene target (PFKFB3) of an “imperfect LD” locus which contains the RA-associated SNP rs706778. Individuals are stratified based on the genotype of each LD SNP that falls within an enhancer. (D) Each individual is color-coded based on his or her haplotype for the rs706778 “imperfect LD” locus (middle). Note that the expression of the predicted target gene PFKFB3 segregates by haplotype only when the multiple enhancer variants are in tight LD (right) (Mann-Whitney-Wilcoxon test). (E) Standard deviation of expression of predicted gene targets within multiple enhancer variant loci with “imperfect LD” for individuals stratified by lead SNP genotype (black) and stratified by haplotype (red) (Mann-Whitney-Wilcoxon test). (F) Odds ratios for multiple enhancer variant loci showing perfect (red) and imperfect LD (black) (Welch's t-test). (*) P < 0.04, (**) P < 0.009.
Figure 5.
Figure 5.
Gene targets of multiple enhancer variants are highly cell type-specific and functionally related. (A) Percent of H3K4me1 sites that are associated with a PreSTIGE prediction, for all GM12878 cell type-specific H3K4me1 sites (gray) and GM12878-specific sites that contain a GWAS SNP that is associated with the six immune-related disorders (red) (χ2, P-value < 0.0001). (B) Cell type specificity (Shannon entropy Q score) of all enhancers in the 12 cell line comparator set (white), GM12878 cell type-specific enhancers (gray), and enhancers containing disease-associated SNPs (red) (Mann-Whitney-Wilcoxon test, P-value < 5.3 × 10⁻⁶). (C) Cell type specificity (Shannon entropy Q-score) of all genes (white), genes associated with a PreSTIGE prediction in GM12878 (gray), and predicted gene targets of disease-correlated SNPs (purple) (Mann-Whitney-Wilcoxon test, P-value < 5.3 × 10⁻⁶). (D) GREAT results for each of the six diseases. Top five significant results are shown for Pathway Commons, GO biological processes/molecular function, and MSigDB pathways categories for each trait.
Figure 6.
Figure 6.
Multiple enhancer variant loci are a common feature of many GWAS traits. (A) Hierarchical clustering of disease traits based on the number of SNPs that intersect with H3K4me1 sites linked to a gene target with PreSTIGE. Cluster of disease traits that correlate with SNPs present in HepG2 (B) and NPC (C) predicted enhancers (zoomed image HepG2 and NPC clusters in A). Genes predicted to be targeted by the disease-correlated SNPs are shown to the right. Columns are ordered as shown in A. (D) Percent of GWAS enhancer loci that involve multiple enhancer variants for each cluster highlighted in A.

References

    1. Akhtar-Zaidi B, Cowper-Sal-lari R, Corradin O, Saiakhova A, Bartels CF, Balasubramanian D, Myeroff L, Lutterbaugh J, Jarrar A, Kalady MF, et al. 2012. Epigenomic enhancer profiling defines a signature of colon cancer. Science 336: 736–739 - PMC - PubMed
    1. Bajpai R, Chen DA, Rada-Iglesias A, Zhang J, Xiong Y, Helms J, Chang CP, Zhao Y, Swigut T, Wysocka J 2010. CHD7 cooperates with PBAF to control multipotent neural crest formation. Nature 463: 958–962 - PMC - PubMed
    1. Barreiro LB, Quintana-Murci L 2010. From evolutionary genetics to human immunology: How selection shapes host defence genes. Nat Rev Genet 11: 17–30 - PubMed
    1. Bernstein BE, Stamatoyannopoulos JA, Costello JF, Ren B, Milosavljevic A, Meissner A, Kellis M, Marra MA, Beaudet AL, Ecker JR, et al. 2010. The NIH Roadmap Epigenomics Mapping Consortium. Nat Biotechnol 28: 1045–1048 - PMC - PubMed
    1. Blankenberg D, Von Kuster G, Coraor N, Ananda G, Lazarus R, Mangan M, Nekrutenko A, Taylor J 2010. Galaxy: A web-based genome analysis tool for experimentalists. Curr Protoc Mol Biol 89: 19.10.1–19.10.21 - PMC - PubMed

Publication types