. 2014 Jan 1;74(1):374-86.
doi: 10.1158/0008-5472.CAN-13-2469. Epub 2013 Nov 6.

Activation of the FGFR-STAT3 pathway in breast cancer cells induces a hyaluronan-rich microenvironment that licenses tumor formation

Affiliations

Activation of the FGFR-STAT3 pathway in breast cancer cells induces a hyaluronan-rich microenvironment that licenses tumor formation

Laura R Bohrer et al. Cancer Res. .

Abstract

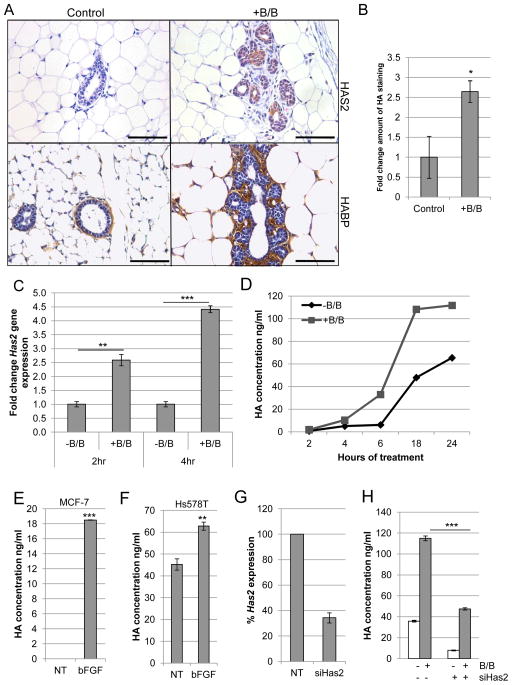
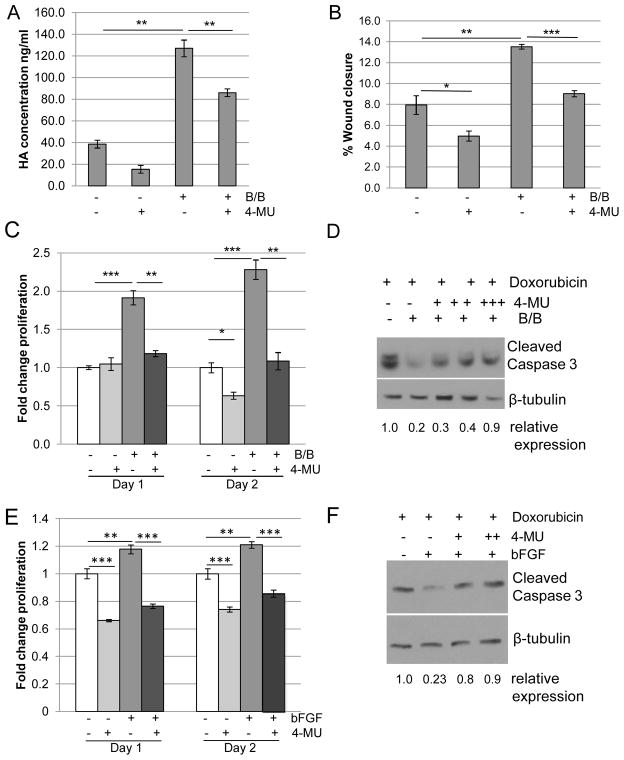
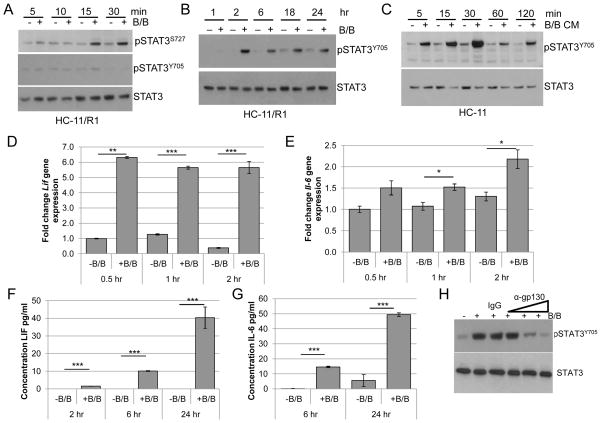
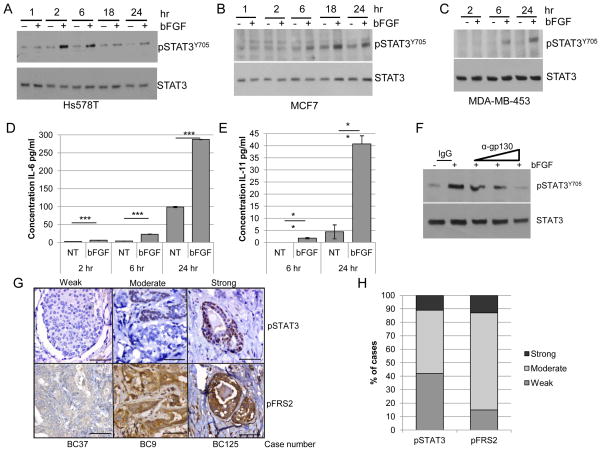
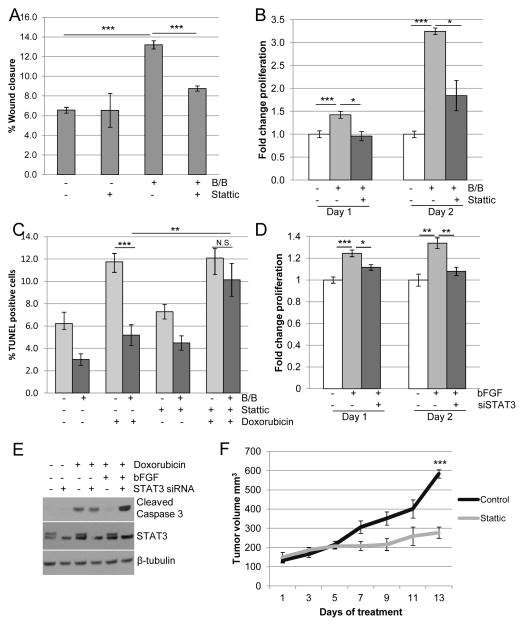
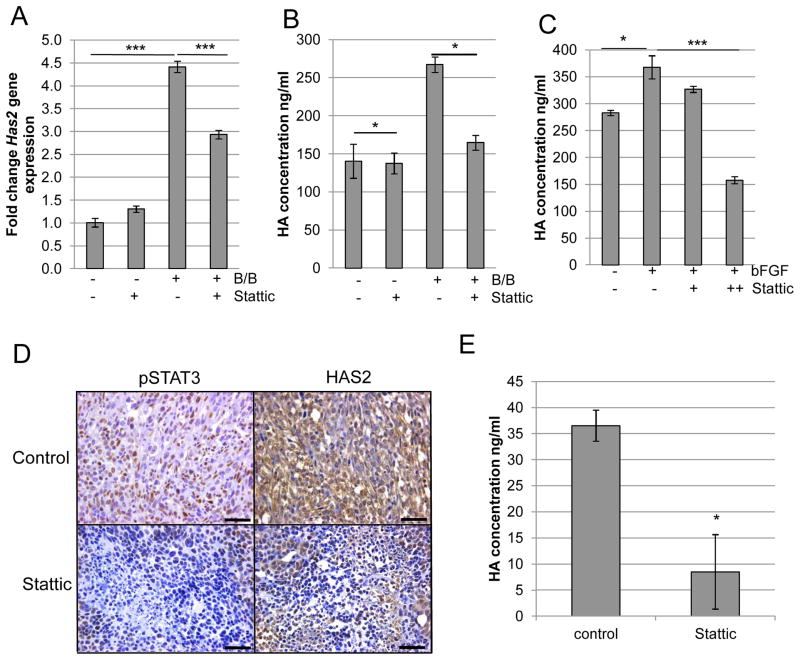
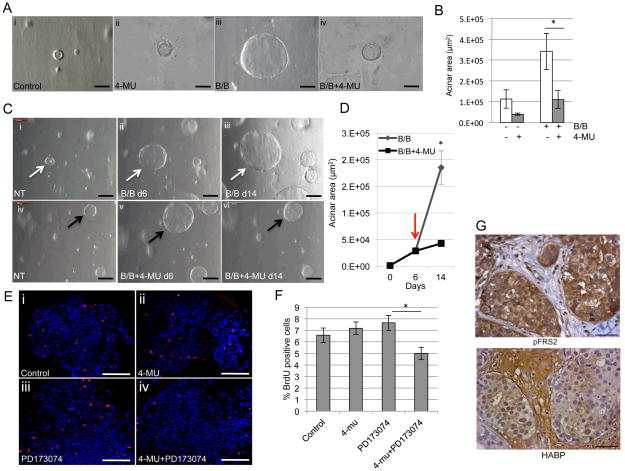
Aberrant activation of fibroblast growth factor receptors (FGFR) contributes to breast cancer growth, progression, and therapeutic resistance. Because of the complex nature of the FGF/FGFR axis, and the numerous effects of FGFR activation on tumor cells and the surrounding microenvironment, the specific mechanisms through which aberrant FGFR activity contributes to breast cancer are not completely understood. We show here that FGFR activation induces accumulation of hyaluronan within the extracellular matrix and that blocking hyaluronan synthesis decreases proliferation, migration, and therapeutic resistance. Furthermore, FGFR-mediated hyaluronan accumulation requires activation of the STAT3 pathway, which regulates expression of hyaluronan synthase 2 (HAS2) and subsequent hyaluronan synthesis. Using a novel in vivo model of FGFR-dependent tumor growth, we demonstrate that STAT3 inhibition decreases both FGFR-driven tumor growth and hyaluronan levels within the tumor. Finally, our results suggest that combinatorial therapies inhibiting both FGFR activity and hyaluronan synthesis is more effective than targeting either pathway alone and may be a relevant therapeutic approach for breast cancers associated with high levels of FGFR activity. In conclusion, these studies indicate a novel targetable mechanism through which FGFR activation in breast cancer cells induces a protumorigenic microenvironment.


Conflict of interest statement

Conflict of interest statement: The authors disclose no potential conflicts of interest.

Figures

Figure 1
Figure 1. FGFR activation leads to increased production of HA
A) MMTV-iFGFR1 transgenic mice were treated with 1mg/kg B/B or solvent for 48 hours. Mammary gland sections were stained with HAS2-specific antibody or HA binding protein (HABP). Magnification bars represent 50μm. B) Quantification of HA-positive stromal thickness in mammary glands from solvent or B/B treated mice. C) HC-11/R1 cells were treated with solvent (-B/B) or 30nM B/B and Has2 gene expression was analyzed by qRT-PCR. D) HC-11/R1 cells were treated as described in (C) and HA expression in conditioned media was determined by ELISA. E,F) MCF-7 (E) and Hs578T (F) cells were treated with or without 50ng/ml bFGF for 18 hours and HA in the conditioned media was determined by ELISA. G) HC-11/R1 cells were treated with Has2 siRNA or a non-targeting (NT) control. Expression of Has2 was measured by qRT-PCR. H) Amount of HA was determined by ELISA. *p<0.05, **p<0.01, ***p<0.001.
Figure 2
Figure 2. Blocking HA synthesis leads to decreased migration, proliferation, and chemoresistance
A) HC-11/R1 cells were treated with 250 μM of the HAS2 inhibitor 4-MU or solvent, followed by the addition of 30nM B/B or solvent. HA was detected in conditioned media by ELISA. B,C) HC-11/R1 cells were treated with B/B, 250μM 4-MU and/or solvent. The change in wound closure was determined at 18 hours (B) and proliferation was measured by an MTT assay (C) at day 1 or 2. D) HC-11/R1 cells were treated with B/B, 4-MU (62.5μM (+), 125μM (++), 250μM 9 (+++)), and 2μM doxorubicin for 24 hours. Levels of cleaved caspase-3 and the loading control β-tubulin were examined by immunoblot analysis. E) Hs578T cells were treated with 50ng/ml bFGF and 25μM 4-MU or solvent. Proliferation was measured at either day 1 or 2 relative to solvent-only treated samples. F) Hs578T cells were treated with bFGF, 4-MU (125μM (+) and 250μM (++)), and doxorubicin and levels of cleaved caspase-3 and β-tubulin were examined. *P<0.05; **p<0.01; and ***p<0.001.
Figure 3
Figure 3. Activation of iFGFR1 leads to increased pSTAT3Tyr705 in a gp130-dependent manner
HC-11/R1 cells were stimulated with solvent (-B/B) or 30nM B/B, followed by protein and RNA extraction or collection of conditioned media. A, B) pSTAT3S727, pSTAT3Y705, and STAT3 (loading control) were examined using immunoblot analysis. C) Conditioned media (CM) samples from treated HC-11/R1 cells were collected and added to HC-11 cells. pSTAT3Y705 and STAT3 was examined using immunoblot analysis. D,E) qRT-PCR analysis was performed to assess Lif or Il-6 gene expression. F,G) LIF and IL-6 expression in conditioned media was assessed by ELISA. H) HC-11/R1 were treated as above with the addition of IgG control or gp130 blocking antibody (0.05, 0.5, 5 μg/ml) for 6 hours. Expression of pSTAT3Y705 and STAT3 was examined by immunoblot analysis. *p<0.05, **p<0.01, ***p<0.001.
Figure 4
Figure 4. FGFR activation leads to pSTAT3Tyr705 in human breast cancer cells
Hs578T (A), MCF7 (B), and MDA-MB-453 (C) were treated with or without 50ng/ml bFGF and expression of pSTAT3Y705 and STAT3 was examined by immunoblot analysis. D,E) Hs578T cells were treated as described above for the indicated times, and conditioned media samples were collected to examine protein expression of IL-6 (D) or IL-11 (E) by ELISA. F) Hs578T cells were treated as above with the addition of IgG control or gp130 blocking antibody (0.1, 1, 10 μg/ml) for 6 hours. G,H) A human breast cancer tissue microarray was stained for pSTAT3Tyr705 and pFRS2 using IHC. G) Representative images of weak, moderate, or strong staining intensity are shown. Magnification bars represent 50μm. H) Percentage of cases based on staining intensity. **p<0.01 and ***p<0.001.
Figure 5
Figure 5. STAT3 promotes FGFR-induced migration, proliferation, and chemoresistance
A) HC-11/R1 cells were treated with solvent or 30nM B/B in the presence of 1μM Stattic or DMSO, and wound closure was measured after 18 hours. B) HC-11/R1 cells were treated with B/B, 2μM Stattic or solvent for 1 or 2 days. Proliferation rate was calculated by MTT assay and given relative to the solvent treated samples. C) Apoptosis was determined by TUNEL assay for HC-11/R1 cells treated with B/B, 4μM Stattic, or 2μM doxorubicin for 24 hours. D) Hs578T cells were treated with NT or STAT3 siRNA for 24 hours, followed by 1 or 2 days treatment with 50ng/ml bFGF, and proliferation was calculated relative to solvent treated samples. E) Hs578T cells were treated as described above, and 2μM doxorubicin was added to the indicated groups for 24 hours. Expression levels of cleaved caspase-3 and β-tubulin were examined by immunoblotting. F) HC-11/R1 cells were injected into the fat pads of Balb/c mice. Mice were given twice weekly injections of 1mg/kg B/B. Once tumors reached a size of 100 mm3, mice received either DMSO or 20mg/kg Stattic and tumor growth was assessed. *p<0.05, **p<0.01, ***p<0.001.
Figure 6
Figure 6. STAT3 regulates expression of HAS2 and production of HA
A) HC-11/R1 cells were treated with 30nM B/B, 4μM Stattic or solvent for 2 hours. RNA was collected to examine expression of Has2 by qRT-PCR. B) HC-11/R1 cells were treated as in (A) for 18 hours. Conditioned media was collected to examine expression of HA by ELISA. C) Hs578T cells were treated with 50ng/ml bFGF and Stattic (2μM (+) or 4μM (++)) or solvent for 18 hours, and levels of HA in the conditioned media were determined by ELISA. D) Serial tumor sections from mice treated with solvent or 20mg/kg Stattic were stained for pSTAT3Tyr705 and HAS2. E) Amount of HA in tumors from mice in D) was assessed by ELISA. *p<0.05, **p<0.01, ***p<0.001.
Figure 7
Figure 7. Inhibition of HA synthesis leads to decreased FGFR-induced growth in 3D culture
A) Primary mammary epithelial cells were isolated from MMTV-iFGFR1 transgenic mice and plated in 3D culture. Cells were treated with 30nM B/B,10μM 4-MU or solvent. Light microscopy images were obtained after 10 days in culture. B) Quantification of acinar area. C) Structures were treated with B/B to activate iFGFR1 for 6 days, followed by treatment with solvent or 4-MU for 8 days. Images were obtained from the same structures. D) Quantification of acinar area. Red arrow indicates addition of 4-MU. E) Hs578T cells were plated in Matrigel. The cells were treated with solvent (Control), 10μM 4-MU, 1μM PD173074 or both for 6 days. The cultures were stained with phospho-histone H3 and analyzed by confocal microscopy. F) Quantification of phospho-histone H3 positive cells. *p<0.05. G) Representative images of pFRS2 and HABP-stained sections of human breast cancers. Magnification bars represent 50μm.

References

    1. Greenman C, Stephens P, Smith R, et al. Patterns of somatic mutation in human cancer genomes. Nature. 2007;446:153–8. - PMC - PubMed
    1. Schwertfeger KL. Fibroblast growth factors in development and cancer: insights from the mammary and prostate glands. Curr Drug Targets. 2009;10:632–44. - PubMed
    1. Dieci MV, Arnedos M, Andre F, Soria JC. Fibroblast growth factor receptor inhibitors as a cancer treatment: from a biologic rationale to medical perspectives. Cancer Discov. 2013;3:264–79. - PubMed
    1. Wu YM, Su F, Kalyana-Sundaram S, et al. Identification of targetable FGFR gene fusions in diverse cancers. Cancer Discov. 2013;3:636–47. - PMC - PubMed
    1. Andre F, Bachelot T, Campone M, et al. Targeting FGFR with Dovitinib (TKI258): Preclinical and Clinical Data in Breast Cancer. Clin Cancer Res. 2013;19:3693–702. - PubMed

Publication types

MeSH terms

Substances