Review
. 2013 Nov 6;33(45):17631-40.
doi: 10.1523/JNEUROSCI.3255-13.2013.

Imaging neuronal populations in behaving rodents: paradigms for studying neural circuits underlying behavior in the mammalian cortex

Affiliations
Review

Imaging neuronal populations in behaving rodents: paradigms for studying neural circuits underlying behavior in the mammalian cortex

Jerry L Chen et al. J Neurosci. .

Abstract

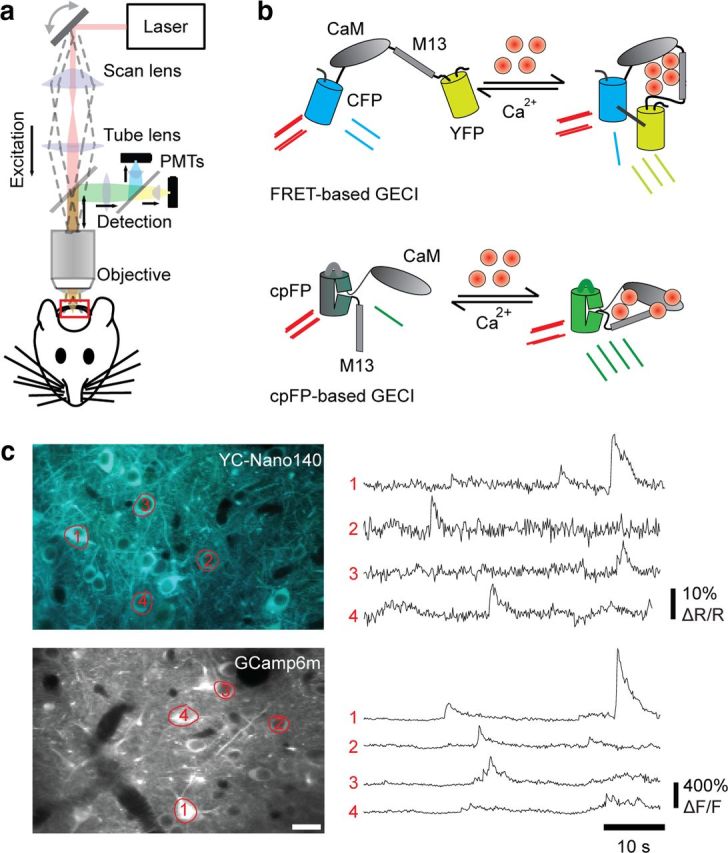
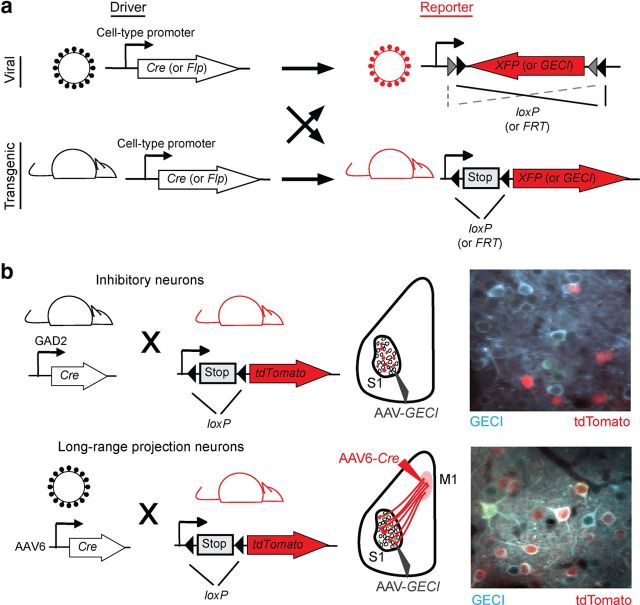
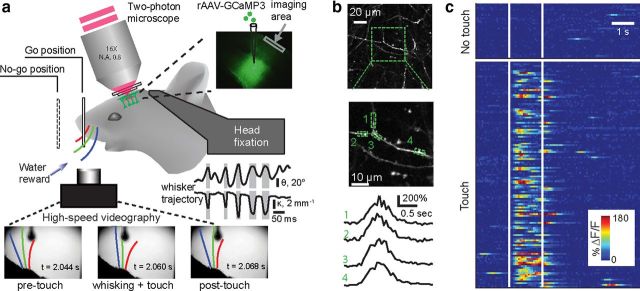
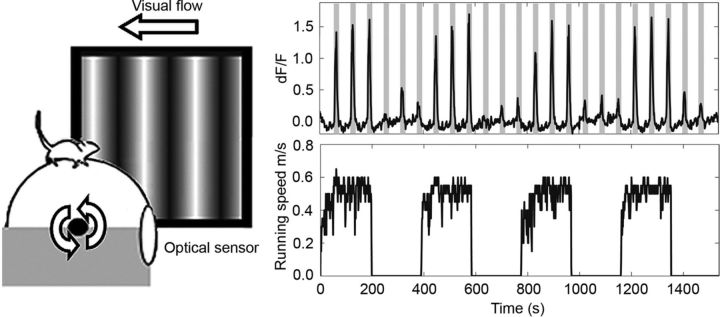
Understanding the neural correlates of behavior in the mammalian cortex requires measurements of activity in awake, behaving animals. Rodents have emerged as a powerful model for dissecting the cortical circuits underlying behavior attributable to the convergence of several methods. Genetically encoded calcium indicators combined with viral-mediated or transgenic tools enable chronic monitoring of calcium signals in neuronal populations and subcellular structures of identified cell types. Stable one- and two-photon imaging of neuronal activity in awake, behaving animals is now possible using new behavioral paradigms in head-fixed animals, or using novel miniature head-mounted microscopes in freely moving animals. This mini-symposium will highlight recent applications of these methods for studying sensorimotor integration, decision making, learning, and memory in cortical and subcortical brain areas. We will outline future prospects and challenges for identifying the neural underpinnings of task-dependent behavior using cellular imaging in rodents.


Figures

Figure 1.
Figure 1.
In vivo two-photon calcium imaging of neuronal activity. a, Schematic of a conventional, mirror-based scanning two-photon microscope for in vivo imaging. b, Schematic of GECIs wherein calcium binding produces a conformation change in the calcium-binding complex (CaM-M13). For FRET-based GECIs, the fusion of a FRET pair (CFP/YFP) allows the conformational change to be measured as an increase in FRET efficiency during two-photon excitation. For cpFP-based GECIs, the fusion of a cpFP allows the conformational change to be detected as an increase in quantum yield of cpFP fluorescence [adapted from Knöpfel (2012) with permission]. c, Examples of new variants of FRET-based GECIs (YC-Nano140) and cpFP-based GECIs (GCamp6m) with in vivo images (left) and calcium traces of indicated cells (right). For FRET-based GECIs, calcium signals are measured as the relative change in the YFP/CFP ratio (ΔR/R). For cpFP GECIs, calcium signals are measured as the relative change in fluorescence intensity (ΔF/F).
Figure 2.
Figure 2.
Genetic tools for dissecting neuronal circuits. a, Site-specific recombinase systems for use to identify neuronal cell types. Viral constructs or transgenic lines driving Cre or Flp recombinase expression under a cell-type-specific promoter can be combined with a reporter for conditional, Cre-dependent, or Flp-dependent fluorescent protein or GECI expression. b, Examples of strategies to identify molecularly and anatomically defined cell types for calcium imaging. Inhibitory (top) or long-range projection (bottom) neurons are labeled using transgenic crosses or retrograde viruses, respectively. Left, Genetic crosses. Middle, Viral injections for imaging in primary somatosensory cortex (S1). Right, In vivo images of GECI-expressing neurons with cell types identified.
Figure 3.
Figure 3.
In vivo two-photon imaging of dendritic Ca2+ signals in task-performing mice. a, Experimental setup; a head-fixed mouse performs a whisker-dependent object localization task under a microscope. The scanning laser beam (red) is focused on distal dendrites of GCaMP3-labeled neurons (green) through an imaging window. The mouse actively whisks to find the pole and makes a lick response (go) or withholds licking (no-go). Whisker motion was recorded with high-speed video (bottom) and quantified (whisker angle, θ, and curvature change, κ; gray shows touch). Top left, Schematic showing two-photon imaging setup. Top right, GCaMP3 is expressed in deep layers of barrel cortex. N.A., Numerical aperture. b, Dendritic tuft branches (top and middle) and Ca2+ signals (ΔF/F; bottom) from different subregions of a single branch (green dashed boxes). Middle panel is a magnified region in the top panel (green square box). c, Color raster of Ca2+ signals (ΔF/F) from all trials of a behavioral session sorted into touch (bottom block, with whisker–object contact) and nontouch (top block, without whisker–object contact) trials. [Adapted from Xu et al. (2012) with permission].
Figure 4.
Figure 4.
Visual responses are increased during locomotion. Left, Schematic of mouse on spherical treadmill with coupled visual feedback [adapted from Keller et al. (2012) with permission]. Right, Changes in fluorescence measured with GCaMP3 in a behaving mouse on a spherical treadmill equipped with a brake (top). Gray bars indicate periods of visual stimulation with drifting gratings. The running speed of the mouse (bottom) shows that visual responses are enhanced by increased running speed.
Figure 5.
Figure 5.
Time-lapse imaging of CA1 place cells in freely moving mice. a, An integrated microscope is equipped with a microendoscope and images CA1 neurons expressing the Ca2+ indicator GCaMP3 via the CAMK2A promoter. The base plate and microendoscope are fixed to the cranium for repeated access to the same field of view. b, A total of 1202 CA1 pyramidal cells (red somata) identified by Ca2+ imaging in a freely moving mouse, atop a mean fluorescence image (green) of CA1. Vessels appear as dark shadows. c, Spatial distributions of the mouse's location during Ca2+ excitation for two example cells in a mouse that explored two arenas. Top, Blue lines show the mouse's trajectory, and red dots mark its position during Ca2+ events. Bottom, Gaussian-smoothed density maps of Ca2+ events, normalized by the mouse's occupancy time per unit area and the cell's maximum response in the two arenas. d–f, Time-lapse imaging of place cell dynamics in a familiar linear track reveals changes in the ensemble representation of space over a month. Shown are place field maps for cells identified on multiple days, ordered by the place fields' centroid positions along the linear track on day 5 (d), day 20 (e), or day 35 (f). Data pooled across n = 4 mice. Scale bars: b, 100 μm; c, 20 cm; d–f, 84 cm. [Panels a and c–f adapted from Ziv et al. (2013) with permission].

References

    1. Akemann W, Mutoh H, Perron A, Park YK, Iwamoto Y, Knöpfel T. Imaging neural circuit dynamics with a voltage-sensitive fluorescent protein. J Neurophysiol. 2012;108:2323–2337. doi: 10.1152/jn.00452.2012. - DOI - PubMed
    1. Andermann ML, Kerlin AM, Reid RC. Chronic cellular imaging of mouse visual cortex during operant behavior and passive viewing. Front Cell Neurosci. 2010;4:3. doi: 10.3389/fncel.2010.00003. - DOI - PMC - PubMed
    1. Andermann ML, Kerlin AM, Roumis DK, Glickfeld LL, Reid RC. Functional specialization of mouse higher visual cortical areas. Neuron. 2011;72:1025–1039. doi: 10.1016/j.neuron.2011.11.013. - DOI - PMC - PubMed
    1. Ayaz A, Saleem AB, Schölvinck ML, Carandini M. Locomotion controls spatial integration in mouse visual cortex. Curr Biol. 2013;23:890–894. doi: 10.1016/j.cub.2013.04.012. - DOI - PMC - PubMed
    1. Barretto RP, Ko TH, Jung JC, Wang TJ, Capps G, Waters AC, Ziv Y, Attardo A, Recht L, Schnitzer MJ. Time-lapse imaging of disease progression in deep brain areas using fluorescence microendoscopy. Nat Med. 2011;17:223–228. doi: 10.1038/nm.2292. - DOI - PMC - PubMed

Publication types