. 2013 Nov 6;33(45):17710-23.
doi: 10.1523/JNEUROSCI.2181-13.2013.

Neural encoding and integration of learned probabilistic sequences in avian sensory-motor circuitry

Affiliations

Neural encoding and integration of learned probabilistic sequences in avian sensory-motor circuitry

Kristofer E Bouchard et al. J Neurosci. .

Abstract

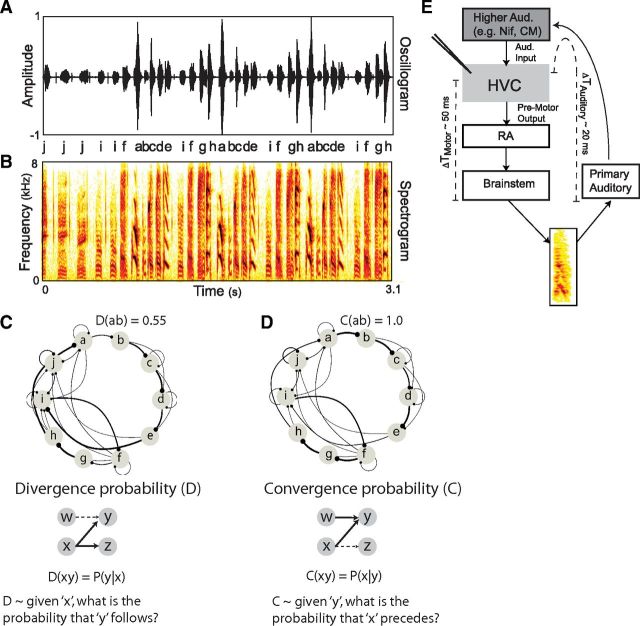
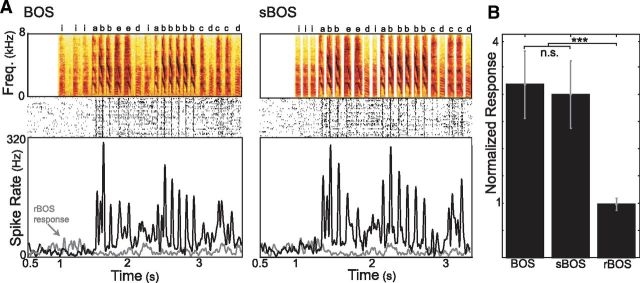
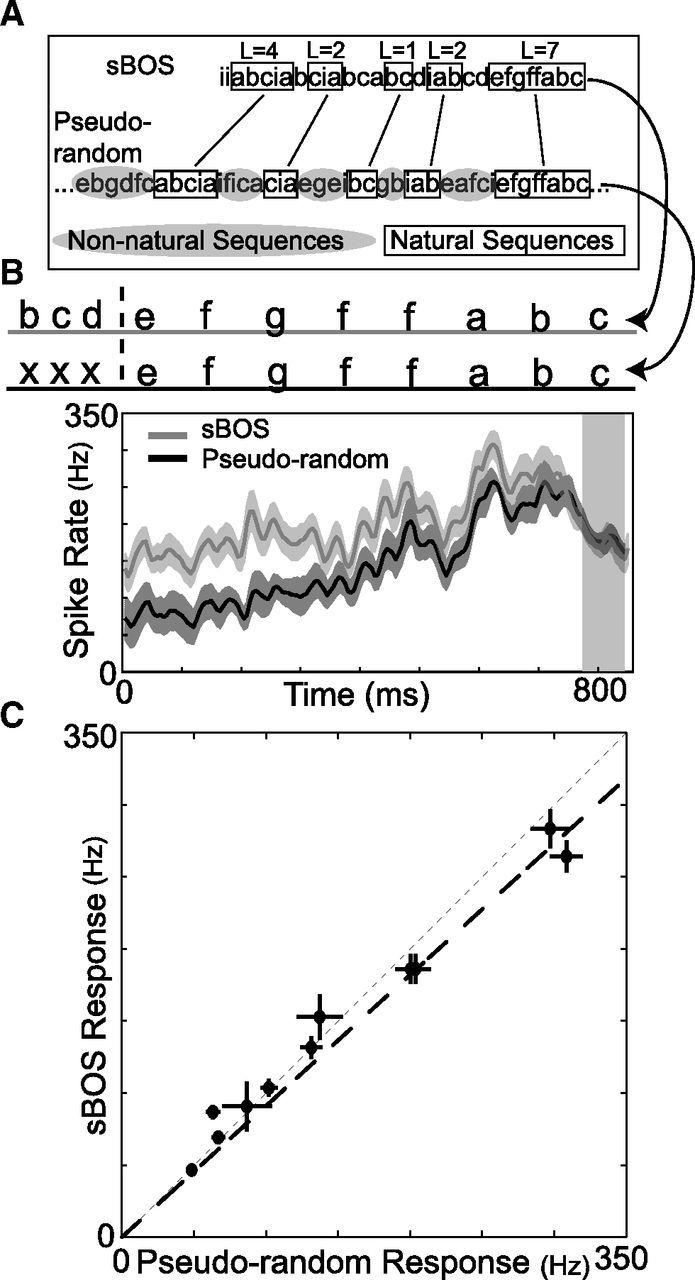
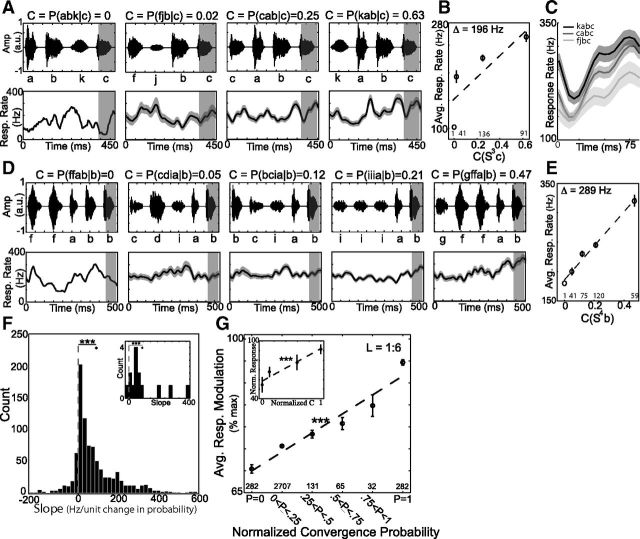
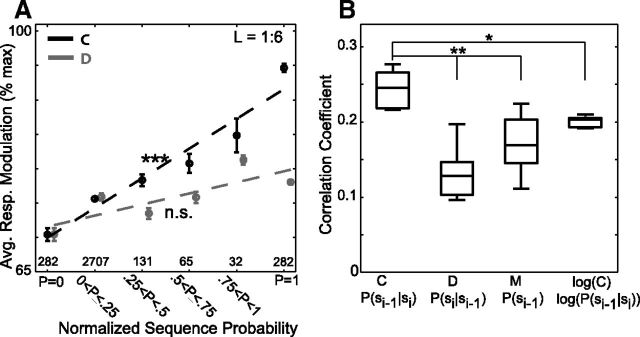
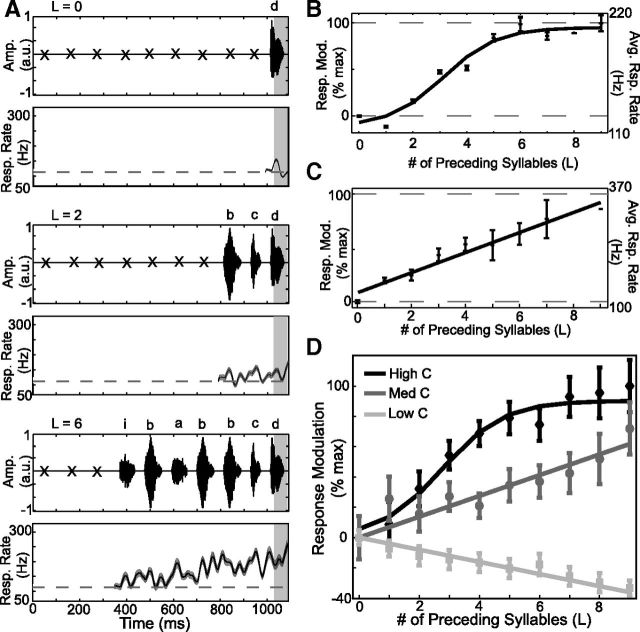
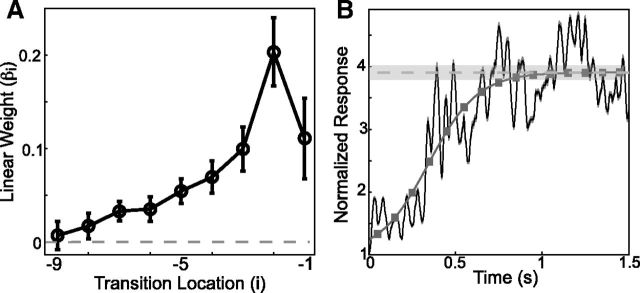
Many complex behaviors, such as human speech and birdsong, reflect a set of categorical actions that can be flexibly organized into variable sequences. However, little is known about how the brain encodes the probabilities of such sequences. Behavioral sequences are typically characterized by the probability of transitioning from a given action to any subsequent action (which we term "divergence probability"). In contrast, we hypothesized that neural circuits might encode the probability of transitioning to a given action from any preceding action (which we term "convergence probability"). The convergence probability of repeatedly experienced sequences could naturally become encoded by Hebbian plasticity operating on the patterns of neural activity associated with those sequences. To determine whether convergence probability is encoded in the nervous system, we investigated how auditory-motor neurons in vocal premotor nucleus HVC of songbirds encode different probabilistic characterizations of produced syllable sequences. We recorded responses to auditory playback of pseudorandomly sequenced syllables from the bird's repertoire, and found that variations in responses to a given syllable could be explained by a positive linear dependence on the convergence probability of preceding sequences. Furthermore, convergence probability accounted for more response variation than other probabilistic characterizations, including divergence probability. Finally, we found that responses integrated over >7-10 syllables (∼700-1000 ms) with the sign, gain, and temporal extent of integration depending on convergence probability. Our results demonstrate that convergence probability is encoded in sensory-motor circuitry of the song-system, and suggest that encoding of convergence probability is a general feature of sensory-motor circuits.


Figures

Figure 1.
Figure 1.
Bengalese finch song, probabilistic characterization of sequence statistics, and sensory-motor organization of the song system. A, B, Example of Bengalese finch (Bf) song. A, Oscillogram (sound amplitude vs time) of a single Bf song segment, below which are the labels arbitrarily assigned to syllables. B, Spectrogram (power at frequency vs time) of the same song. C, Divergence diagram of syllable sequencing compiled from a large corpus of songs from this bird. Each node corresponds to a unique syllable from the bird's repertoire. Edge thickness corresponds to the observed divergence probability for transitions between syllables. The divergence probability for transition “xy,” denoted D(xy), reflects the probability that an “x” will be followed by a “y” [i.e., P(y|x)]. D, Convergence diagram compiled from the same corpus of songs as in C. The convergence probability for transition “xy,” denoted C(xy), reflects the probability that a “y” will be preceded by an “x” [i.e., P(x|y)]. Convergence and divergence probabilities can differ for the same transition. For example, in this case the divergence probability for transitions from “a” to “b” was approximately one-half [D(ab) = P(b|a) = 0.55], whereas the convergence probability for transitions to “b” from “a” was 1 [C(ab) = P(a|b) = 1.0]. E, Diagram of the avian song system. Acute recordings were made in nucleus HVC (used as proper name). There is a premotor latency of ∼50 ms (ΔTMotor) between activity in HVC and subsequent vocalization. In addition, there is a latency of ∼20 ms (ΔTAuditory) for auditory activity to reach HVC. This makes for a total auditory-motor latency between premotor activity and resulting auditory feedback of ∼70 ms.
Figure 2.
Figure 2.
Synthetic version of BOS, which isolates sequence variability, is an effective stimulus. A, Example spectrograms of BOS and sBOS. Below each spectrogram is the spike raster and associated instantaneous spike rate from one HVC site recorded over 50 trials; black lines indicate responses to BOS or sBOS, gray lines indicate responses to a control stimulus, rBOS. B, Average auditory responses (divisively normalized to baseline firing rate, mean ± SE) to BOS, sBOS, and rBOS. (nonsignificant: p > 0.5, Wilcoxon signed-rank test; ***p ≤ 10−10, with Bonferroni correction; data from 47 sites in n = 7 birds).
Figure 3.
Figure 3.
Pseudorandom sequences are effective auditory stimuli. A, Illustrative pseudorandom stimulus sequence. Pseudorandom stimuli were designed to contain naturally occurring sequences (examples in black boxes) of various lengths randomly interleaved with non-naturally occurring sequences (examples in gray ovals). Within the pseudorandom stimuli, we define a natural sequence of length L (e.g., SL = efgffab, L = 7) preceding a target syllable (e.g., s0 = c) as a string of L syllables sequenced as in BOS, preceded by a syllable that does not naturally occur before the first syllable [i.e., P(x|e) = 0]. A sample BOS segment is shown above and lines connect naturally occurring sequences that were present in both sBOS and pseudorandom stimuli. B, Example of auditory responses at one site to the same naturally occurring sequence (“efgffabc”) that occurred in both sBOS (gray) and pseudorandom (black) stimuli (mean ± SE). In this case, the response to the last syllable (shaded region) was the same regardless of which stimulus it occurred in. C, Average magnitude of auditory responses to a syllable when preceded by the same sequence of 7 syllables in sBOS and pseudorandom stimuli. Each datum corresponds to one recording site and shows the mean ± SE of the responses to all syllables. Thin gray dashed line is unity. Thick black line is from regression. Responses were not different between stimuli (p > 0.5, Wilcoxon signed-rank test) and exhibited a strong linear relationship (r = 0.93, p ≤ 10−8).
Figure 4.
Figure 4.
Convergence probability of preceding sequences modulates auditory responses to single syllables in a positive, linear manner, A, Average time varying responses (mean ± SE) and accompanying stimuli for length 3 sequences with varying convergence probability, followed by the target syllable “c.” B, Average responses to the target syllable “c” (mean ± SE for shaded region in A) when preceded by the sequences in A. C, Response waveform for syllable “c” when preceded by the 3 naturally occurring sequences shown in A. D, E, Second example illustrating increasing responses to target syllable “b” as a function of convergence probability for preceding length 4 sequences. D, Average time varying responses (mean ± SE) and accompanying stimuli for length 4 sequences with varying convergence probability, followed by the target syllable “b.” E, Average responses to the target syllable “b” (mean ± SE for shaded region in D) when preceded by the sequences in D. F, Distribution of slopes for regression of responses to target syllables against convergence probability of preceding sequences for entire dataset (***p < 10−10, one sample t test, n = 945 cases). Black diamond: mean slope (90 Hz/unit change in C). Inset shows histogram of slope values for experiments on single units (***p < 10−3, one-sample t test). Black diamond: mean = 96 Hz/unit change in probability. G, Response modulation as a function of convergence probability for all syllables and sequences of lengths 1–6 (mean ± SE). The slope of the regression line (dashed line) was significantly different from 0 (***p < 10−3). Inset shows results from single units, mean ± SE, and best-fit line (***p < 10−4). Number of unique instances of the sequences in B, E, and G are indicated at bottom of plots.
Figure 5.
Figure 5.
Convergence probability explains more variation in auditory responses than other probabilistic characterizations of sequencing. A, Response modulation as a function of convergence probability (black) and divergence probability (gray) for all syllables and sequences of lengths 1–6, as well as the best-fit lines from linear regression (***p < 10−3; nonsignificant: p > 0.05; H0: slope = 0). B, Correlation coefficients resulting from fitting a GLM to auditory responses using four different probabilistic characterizations of sequence statistics as regressors. (*p < 0.05, **p < 0.01, Wilcoxon signed-rank test, with Bonferroni correction, n = 9 for all distributions). Boxes indicate median, 25th, and 75th percentiles, whiskers extend to ± 2.7 SD, 95% confidence intervals.
Figure 6.
Figure 6.
Integration of auditory responses extends over many syllables and is dependent on convergence probability. A, B, Example of response integration for high-probability sequences. A, Series of acoustic stimuli (x: non-naturally sequenced syllables, conditioned on subsequent sequence) and resulting average response (mean ± SE) for sequences of length L = 0 (“d”), L = 2 (“bcd”), and L = 6 (“ibabbcd”) ending in the same syllable (s0 = “d”). Dashed black line in response plots is the mean activity during the entire pseudorandom stimulus. B, Average (± SE) response modulation (left ordinate) and response rate (right ordinate) for “d” and best-fitting sigmoid function. C, Example of response integration for medium-probability sequences. Average (±SE) response modulation (left ordinate) and response rate (right ordinate) for the last syllable and best linear fit. D, Average response modulation for sequences of high probability (black diamonds with sigmoidal fit), medium probability (dark gray circles with linear fit), and low probability (light gray squares with linear fit). Data are presented as means ± SE.
Figure 7.
Figure 7.
Evidence for integration from GLM analysis and sBOS responses. A, Auditory responses depend on convergence probability at distant transition locations. Linear weights (βi) describing modulations of auditory responses due to pairwise convergence probability as a function of the location of the transition (i). Data are presented as means ± SE, n = 38 for all. B, Long-time dependent integration in sBOS responses. The average baseline normalized auditory response evoked by the first 1.5 s of sBOS stimuli (black, mean ± SE, n = 47). The dark gray line corresponds to the best-fitting sigmoid function, with the estimated asymptotic value demarcated in light gray (± 1 SD of estimated value). Dark gray boxes demarcate the average approximate location of syllable centers.

References

    1. Ashmore RC, Wild JM, Schmidt MF. Brainstem and forebrain contributions to the generation of learned motor behaviors for song. J Neurosci. 2005;25:8543–8554. doi: 10.1523/JNEUROSCI.1668-05.2005. - DOI - PMC - PubMed
    1. Barlow HB. Possible principles underlying the transformation of sensory messages. In: Rosenblith WA, editor. Sensory communication. Cambridge, MA: MIT; 1961. pp. 217–234.
    1. Bauer EE, Coleman MJ, Roberts TF, Roy A, Prather JF, Mooney R. A synaptic basis for auditory-vocal integration in the songbird. J Neurosci. 2008;28:1509–1522. doi: 10.1523/JNEUROSCI.3838-07.2008. - DOI - PMC - PubMed
    1. Bouchard KE, Ganguly S, Brainard MS. Hebbian mechanisms underlying the learning of Markov sequence probabilities. Soc Neurosci Abstr. 2012;38:846.16.
    1. Brainard MS, Doupe AJ. Auditory feedback in learning and maintenance of vocal behaviour. Nat Rev Neurosci. 2000;1:31–40. doi: 10.1038/35036205. - DOI - PubMed

Publication types