. 2013 Nov 6;33(45):17797-813.
doi: 10.1523/JNEUROSCI.2778-13.2013.

Genetic dissection of retinal inputs to brainstem nuclei controlling image stabilization

Affiliations

Genetic dissection of retinal inputs to brainstem nuclei controlling image stabilization

Onkar S Dhande et al. J Neurosci. .

Abstract

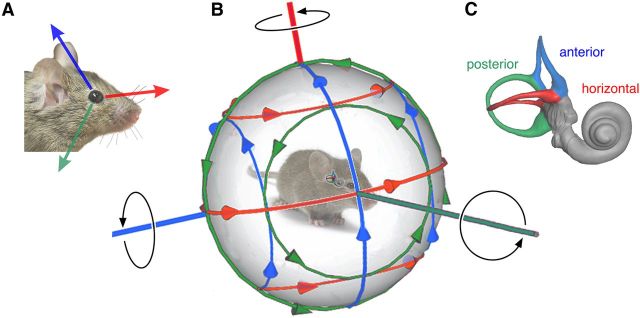
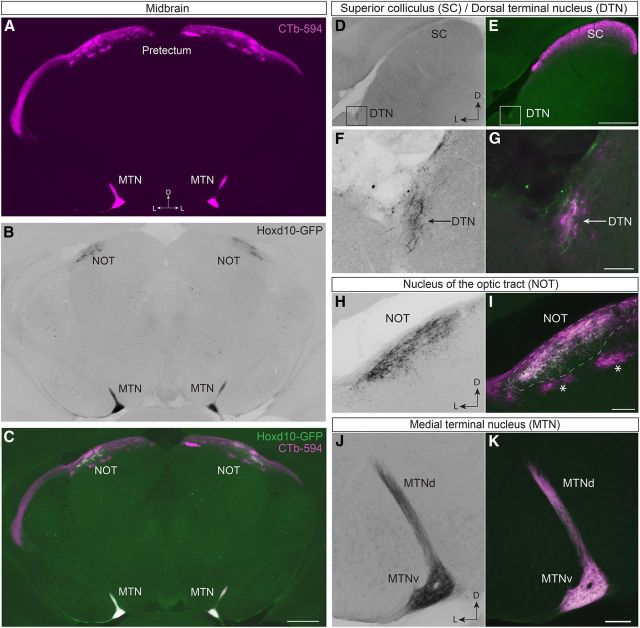
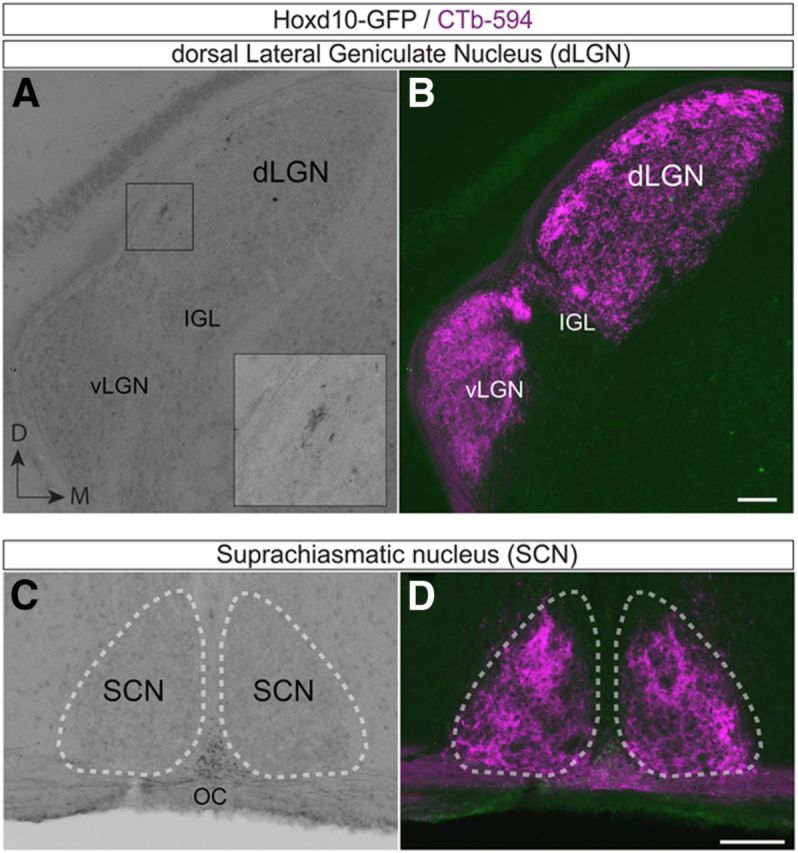
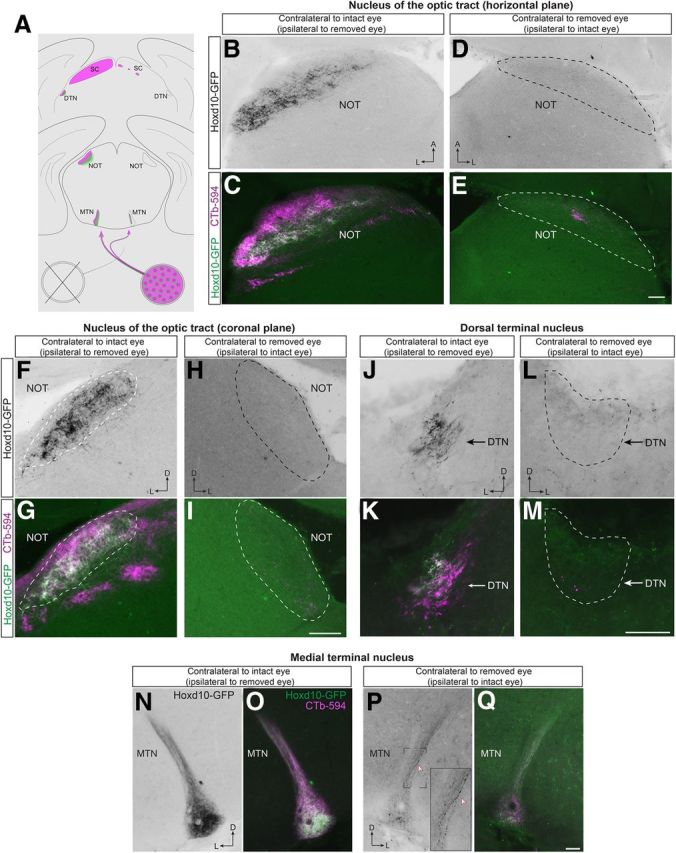
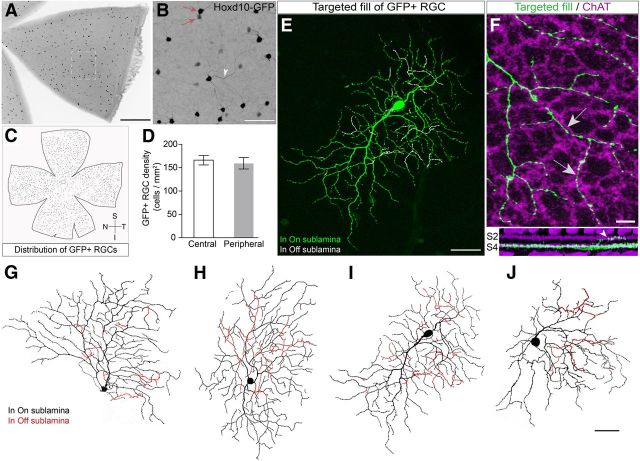
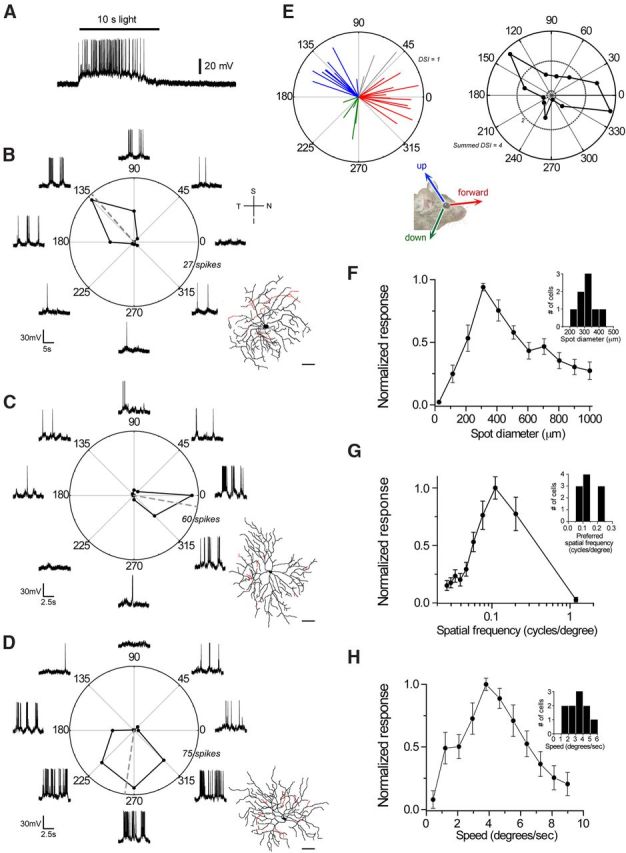
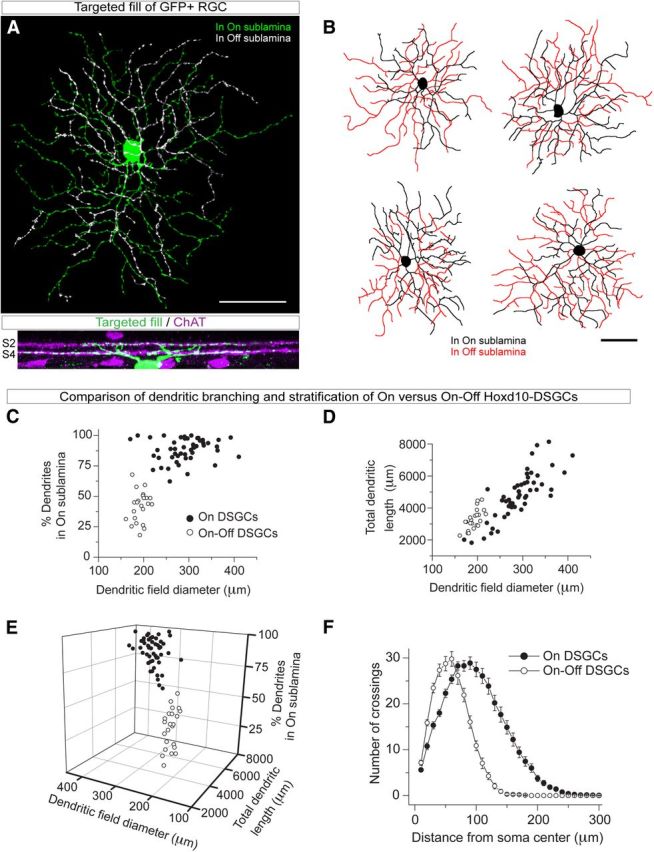
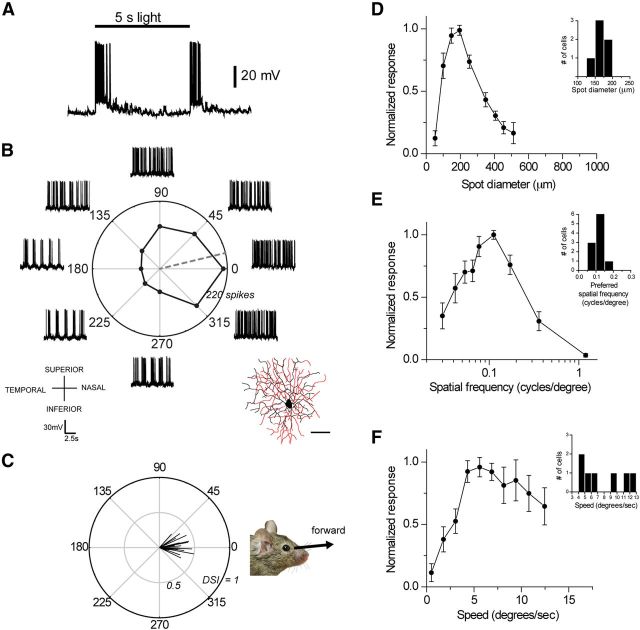
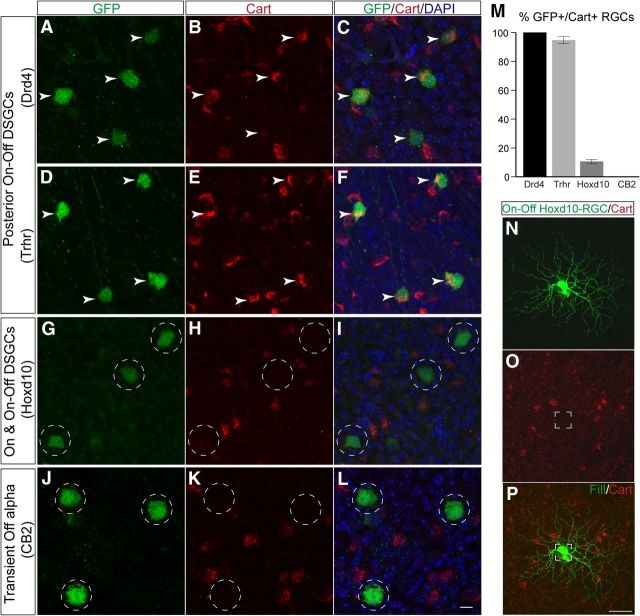
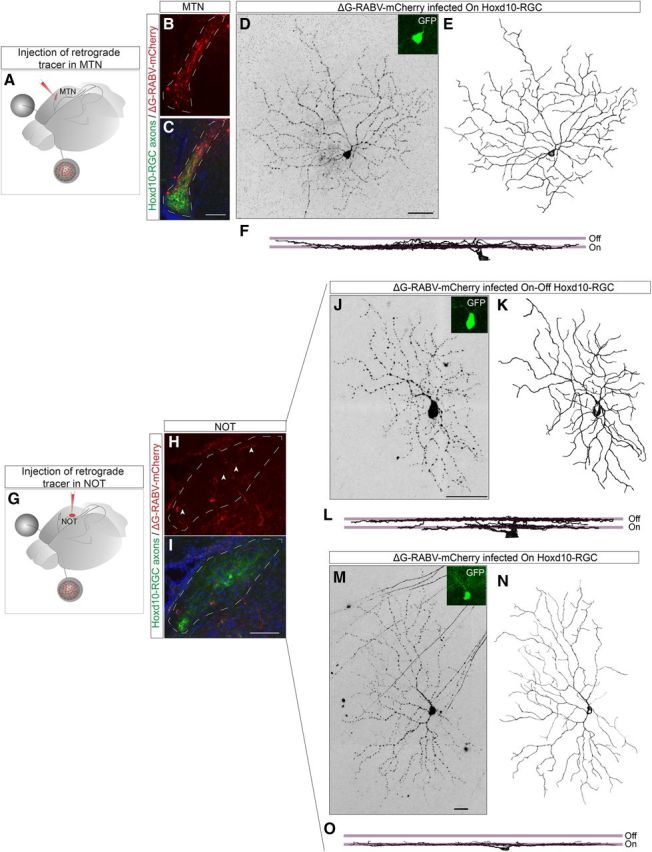
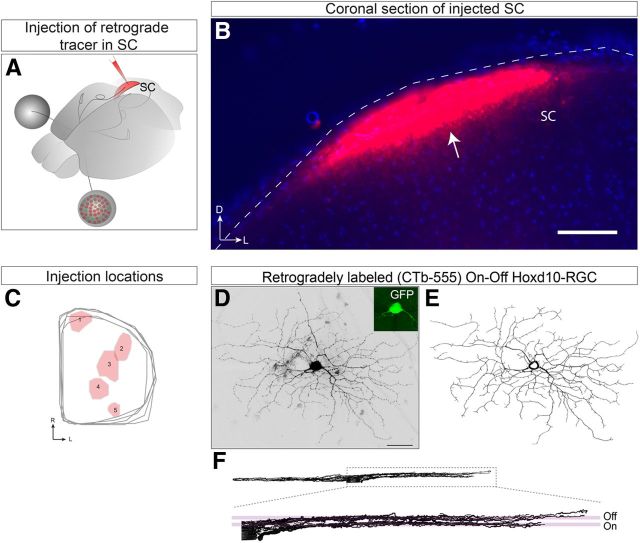
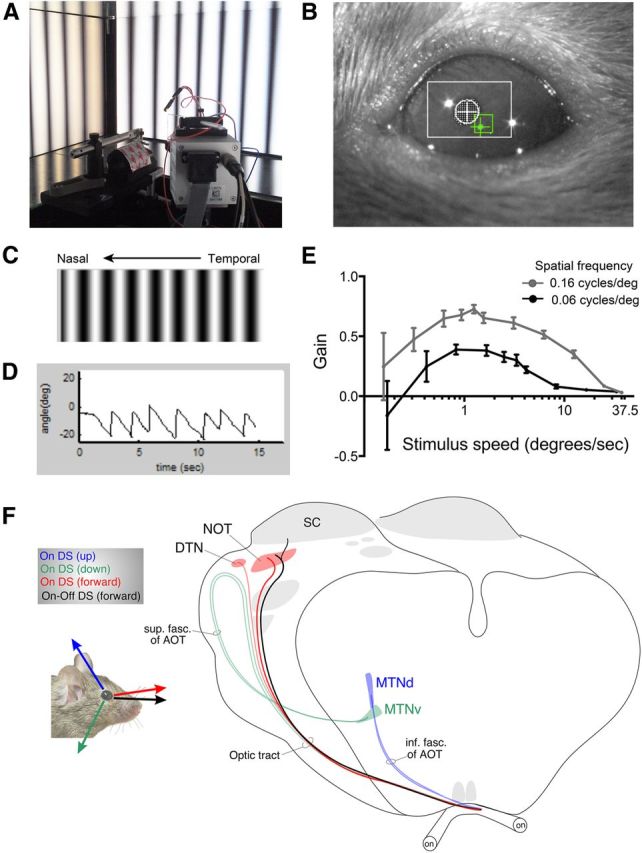
When the head rotates, the image of the visual world slips across the retina. A dedicated set of retinal ganglion cells (RGCs) and brainstem visual nuclei termed the "accessory optic system" (AOS) generate slip-compensating eye movements that stabilize visual images on the retina and improve visual performance. Which types of RGCs project to each of the various AOS nuclei remain unresolved. Here we report a new transgenic mouse line, Hoxd10-GFP, in which the RGCs projecting to all the AOS nuclei are fluorescently labeled. Electrophysiological recordings of Hoxd10-GFP RGCs revealed that they include all three subtypes of On direction-selective RGCs (On-DSGCs), responding to upward, downward, or forward motion. Hoxd10-GFP RGCs also include one subtype of On-Off DSGCs tuned for forward motion. Retrograde circuit mapping with modified rabies viruses revealed that the On-DSGCs project to the brainstem centers involved in both horizontal and vertical retinal slip compensation. In contrast, the On-Off DSGCs labeled in Hoxd10-GFP mice projected to AOS nuclei controlling horizontal but not vertical image stabilization. Moreover, the forward tuned On-Off DSGCs appear physiologically and molecularly distinct from all previously genetically identified On-Off DSGCs. These data begin to clarify the cell types and circuits underlying image stabilization during self-motion, and they support an unexpected diversity of DSGC subtypes.


Figures

Figure 1.
Figure 1.
Vestibular and visual components of the AOS. A, The three major axes of visual slip (upward, blue; forward, red; and downward, green) experienced by cells in the retina when the head moves. B, The three major axes of visual slip. The arrows represent the direction of slip along each of the three major axes. C, Semicircular canals of the inner ear that respond to the three major axes of head movements: horizontal (red), anterior (blue), and posterior (green).
Figure 2.
Figure 2.
Genetic labeling of RGC axons that densely innervate all subcortical nuclei controlling image stabilization. A, Coronal view of midbrain. RGCs labeled with CTb–594 (magenta). B, Hoxd10–GFP+ RGC axons (black) terminate in the NOT and MTN. C, Merged image of RGCs labeled with CTb–594 (magenta) and Hoxd10–GFP RGC axons (green; hereafter Hoxd10–RGCs). D, E, Hoxd10–RGC axons innervate the DTN but provide only sparse input to the largest and most commonly innervated subcortical visual target, the SC. Labeling (color) conventions as in A–C. F, G, High-magnification view of Hoxd10–GFP terminations in the DTN (corresponds to boxed region in D, E). H, Within the pretectum, Hoxd10–RGC axons are restricted to the NOT (black). I, Merged signals from Hoxd10–RGC axons (green) and RGC axons collectively (magenta) reveals the specificity of Hoxd10–RGC axon targeting to the NOT (white outline); two pretectal nuclei neighboring the NOT (asterisks) do not receive axons from Hoxd10–RGCs. J, K, Both the dorsal and ventral MTN (MTNd and MTNv) receive dense axonal input from Hoxd10–RGCs. Comparison of the spatial extent of GFP (J, black) and labeling of RGC axons (K, magenta) reveals that Hoxd10–RGC axons occupy the entire MTN structure. D, Dorsal; L, lateral. Scale bars: C, E, 500 μm; G, 50 μm; I, K, 100 μm.
Figure 3.
Figure 3.
Minimal input from Hoxd10–RGCs to subcortical retinorecipient targets involved in circadian rhythms, directed gaze, or image formation. A, Sparse input to the subcortical target involved in image formation, the dLGN from Hoxd10–RGCs. Inset, A small patch of GFP+ axon terminals near the optic tract. The majority of the dLGN is primarily devoid of Hoxd10–RGC inputs. B, CTb–594 labeling of RGCs (magenta) in the same plane as A. RGC axons terminate throughout this target. C, D, Hoxd10–RGCs do not innervate the suprachiasmatic nucleus (SCN, white outline), a structure involved in circadian entrainment. IGL, Inner granule layer; vLGN, ventral LGN; D, dorsal; M, medial; OC, Optic chiasm. Scale bars: B, D, 100 μm.
Figure 4.
Figure 4.
Hoxd10–RGCs are the source of GFP+ axons in AOS targets, and they project almost entirely to the contralateral brain hemisphere. A, Experimental paradigm for determining the origin of GFP+ axons in the AOS target structures in the Hoxd10–GFP mouse line. The right eye of adult Hoxd10–GFP mice were surgically removed. Approximately 3 weeks later, tracer CTb–594 was injected in the spared eye (left eye). Visual target structures in both hemispheres were analyzed for the presence or absence of GFP+ and CTb–594+ axons fibers. B–I, GFP+ and CTb–594+ axons were observed in the contralateral side of the intact eye (B, C, F, G). The NOT contralateral to the removed eye was completely devoid of GFP+ fibers, and almost complete lack of CTb signal confirmed that eye removal resulted in degeneration of RGC inputs to the NOT (D, E, H, I). J–M, Removal of the right eye results in complete loss of GFP signal in the contralateral hemisphere in the DTN (while outline). N, Hoxd10–RGC axons (black) from the intact eye in the contralateral MTN. O, RGC axons of the intact eye are bulk labeled with CTb–594 (magenta). P, Q, Only a few GFP+ retinal fibers are present in the MTN contralateral to the removed eye, demonstrating that the Hoxd10–RGCs are predominately contralateral projecting. D, Dorsal; L, lateral; A, anterior. Scale bars: E, I, 100 μm; M, G, 50 μm.
Figure 5.
Figure 5.
Dye-filled Hoxd10–RGCs display On–DSGC-like morphology. A, B, High magnification of a leaflet of Hoxd10–GFP retina (B corresponds to boxed region in A). The presence of GFP+ RGC doublets (B, red arrows), a violation of mosaic organization, suggests the presence of multiple RGC subtypes. There was no tendency for brighter or dimmer GFP+ RGCs to reside close to one another (data not shown). Note that partial dendrites (white arrowhead) are visible without immunostaining in adult Hoxd10–GFP mice. C, Example flat-mount Hoxd10–GFP mouse retina (black outline) showing distribution of GFP+ RGCs (black dots). GFP+ RGCs are observed throughout the entire retina. D, Quantification of density of GFP+ RGCs in adult Hoxd10–GFP mice. The relatively small number of GFP+ RGCs (∼2000; Results) and uniform density suggests that only a few subtypes of RGCs are present in the Hoxd10–GFP mouse line. E, Example Hoxd10–RGC filled with Alexa Fluor 488 hydrazide (green) reveals On–DSGC-like dendritic morphology. Hoxd10–RGC dendrites in green represent dendritic branches in the On sublamina in the IPL of the retina, and pseudocolored white represent branches in the Off sublamina of the IPL. Reconstructed trace of this cell is shown in I. F, Dendrites of a filled GFP+ Hoxd10–RGC costratify and cofasciculate (white arrows) with the On starburst amacrine dendrites (magenta, ChAT) in the IPL. Confocal z-stack shows dendrites in the On sublamina (S4), with a small dendritic branch in the Off sublamina (S2). G–J, Example en face view of reconstructions of targeted Hoxd10–RGC fills with On–DSGC-like dendritic morphologies. Dendrites stratifying in the On or Off sublamina of the IPL are drawn in black and red, respectively. Scale bars: A, 500 μm; B, 100 μm; E, G–J, 50 μm; F, 10 μm. S, Superior; T, temporal; I, inferior; N, nasal.
Figure 6.
Figure 6.
Hoxd10–RGCs include On–DSGCs encoding three different directions of motion. A, Example whole-cell current-clamp recording from a GFP+ Hoxd10 On–DSGC (same as cell shown in B) shows sustained firing in response to a 10 s step of light (362-μm-diameter spot aligned to the receptive field center of the cell). B–D, Example polar plot of evoked firing rate as a function of grating drift direction. All three canonical On directions in visual space: upward (B), forward (C), and downward (D) are represented in the Hoxd10–GFP mouse line. Dashed gray line indicates the vector sum of responses. Morphology of the recorded cell is shown to the right of each polar plot (black, On sublamina; red, Off sublamina of IPL). Grating dimensions were custom constructed for each cell according to the preferred spatial frequency and speed tuning of each cell and were 0.06, 0.08, and 0.13 cycles/° and speed of 3.2, 6.3, and 3.8°/s for cell in B–D, respectively. E, Summary of directional preference of all recorded On–DSGCs (n = 30 cells). Plot on the left shows the preferred direction in space, and DSIs are represented by the angle and length of the line, with coloring scheme to divide the polar plot into three 90° segments (see Materials and Methods). Twenty-seven of 30 On–DSGCs fell in these three ranges. Three of 30 Hoxd10 On–DSGCs exhibited tuning in the 45–90° range (gray). Plot on the right (black) shows summed DSI magnitudes of all 30 recorded cells plotted as a function of bin group angle (binned every 30°; see Materials and Methods), demonstrating that the maximum summed DSIs cluster into bins for angles closely matching forward and upward directions, with a small contribution of summed DSIs from the downward population. F–H, On–DSGCs prefer slow moving contrast gratings and large-diameter spots of light. Normalized maximum firing rate plotted as a function of spot size (F), spatial frequency (G), and drift speed (H) of grating drifted at the predetermined preferred direction of each cell. Mean ± SEM peak spot diameter, spatial frequency, and speed values were 319.6 ± 23.0 μm (n = 8), 0.13 ± 0.05 cycles/° (n = 10), and 3.20 ± 0.40°/s (n = 10). Histograms demonstrating the range of values observed are shown as insets plots in F and G. Scale bar, 50 μm. Error bars indicate SEM. S, Superior; T, temporal; I, inferior; N, nasal.
Figure 7.
Figure 7.
Hoxd10–RGC include cells that morphologically resemble On–Off DSGCs. Targeted fill (A) and reconstructions (B) reveals a second RGC subtype marked in Hoxd10–GFP mice that costratifies with both the On–ChAT and Off–ChAT bands (magenta) in the IPL of the retina. C–F, Morphological comparison of On–DSGCs (filled circles, n = 50) and On–Off RGCs (open circles, n = 23) filled by sharp electrode intracellular dye injection or diffusion of dye during whole-cell patch-clamp recording. 3D scatter plot (E) of percentage dendritic arbor in the On sublamina of the IPL, dendritic field diameter, and total dendritic field length was constructed by combining the 2D scatter plots in C and D. The 3D plot in E is shown at a 13% perspective angle to illustrate clustering of data into two distinct populations based on these morphological parameters. In addition, On–Off RGC dendritic arbors differ from those of On–DSGCs when analyzed by Sholl analysis (F). Scale bar, 50 μm. Error bars indicate SEM.
Figure 8.
Figure 8.
Hoxd10 On–Off RGCs are forward tuned and respond to slow velocities. A, Example whole-cell current-clamp recording from an On–Off RGC labeled in the Hoxd10–GFP mouse line shows transient firing in response to the onset and offset of a 5 s step of light (168 μm spot aligned to the receptive field center of the cell). B, C, Recordings demonstrate that On–Off Hoxd10–RGCs have relatively weak directional preference for temporal-to-nasal (forward) motion in visual space. This is illustrated by the example polar plot of evoked firing rate as a function of grating drift direction (B) and the population data of DSI magnitude and direction (C, n = 17 cells), plotted as in Figure 6E. Observe that the magnitude of DSI is <0.5 for all the cells tested under these conditions (compare with plot in Fig. 6E). Morphology of the recorded cell in B is shown to the right of the polar plot (black, On sublamina; red, Off sublamina of IPL). D–F, Hoxd10 On–Off RGCs prefer small spots and show robust response to slow moving gratings. Summary of preferred spot diameter (D; note that spikes evoked by light onset only were counted), spatial frequency (E), and drift speed (F) of grating drifted at the predetermined preferred direction of each cell. Mean ± SEM peak spot diameter, spatial frequency, and speed values were 163.8 ± 9.9 μm (n = 6 cells), 0.11 ± 0.01 cycles/° (n = 10 cells), and 7.7 ± 1.2°/s, respectively (n = 7). Histograms demonstrating the range of values observed are shown as inset plots in D–F. Scale bar, 50 μm.
Figure 9.
Figure 9.
The vast majority of Hoxd10–RGCs do not express Cart, a marker for previously genetically identified On–Off DSGCs. A–F, Virtually all Drd4–GFP RGCs (A–C) and Trhr–GFP RGCs (D–F) (green) express Cart (red), a marker for On–Off DSGCs (Kay et al., 2011). White arrowheads indicate colocalization of GFP and Cart. G–L, The vast majority of Hoxd10–RGCs (G–I) and CB2-RGCs (J–L) do not express Cart. Nuclei are labeled with DAPI (blue) in A–L. Dashed circles indicate lack of Cart overlap with GFP signal. M, The percentage of different RGC subtypes that each coexpress Cart. N–P, Example of a targeted and dye-filled Hoxd10–RGC. This cell is On–Off bistratified and is not immunopositive for Cart. Boxed region indicates cell body location of filled RGCs. Scale bars: L, P, 50 μm.
Figure 10.
Figure 10.
A combination of On–DGSCs and On–Off DGSCs project to the AOS target for horizontal nystagmus but not for the target involved in vertical nystagmus. A, Schematic of retrograde labeling experiments. Modified rabies virus encoding mCherry (ΔG–RABV–mCherry) was made in the MTN of Hoxd10–GFP mice to infect RGCs forming synaptic contacts within the MTN (red, injection site). Double-labeled (mCherry+ and GFP+) RGCs in retinas of injected mice were analyzed. B, C, Example of a site of infection (B, white outline) that is within the MTN. C, Example of an On Hoxd10–RGC retrogradely infected from the MTN. E, En face view (reconstruction) of an RGC shown in D. F, Side view of the dendrites of the Hoxd10–RGC shown in D and E demonstrate that the dendrites are monostratified and reside in the On sublamina of the IPL of the retina. G, Schematic of experimental setup for retrograde labeling from the NOT (similar to A). H, I, mCherry+ axon terminals (arrowheads) were observed within the GFP axon containing domain of the NOT. J, Example On–Off Hoxd10–RGC projecting to the NOT. Side view (L) of the reconstruction (K) demonstrates that the dendrites of the neuron in J stratify in the On and Off sublamina of the IPL. M, Example of an On Hoxd10–RGC forming synaptic contacts in the NOT and en face view of reconstruction (N) of RGC shown in M. O, Side view of the dendrites of the On Hoxd10–RGC.
Figure 11.
Figure 11.
Retrograde labeling and anatomical identification of the Hoxd10–RGCs projecting to the SC indicates that they are On–Off DSGCs. A, Schematic of experimental paradigm. CTb–555 was injected in the SC, and double-positive (GFP+ and CTb–555+) Hoxd10–RGCs were analyzed. B, Representative example of collicular injection. Scale bar, 500 μm. C, Summary of injection locations in the SC shown in top view. D, Example On–Off Hoxd10–RGC retrogradely labeled from the SC. Scale bar, 50 μm. E, Reconstruction of retrogradely labeled Hoxd10–RGC shown in D. F, Side view of the same On–Off Hoxd10–RGC demonstrates that the dendrites of the retrogradely labeled RGC are in the On and Off sublamina of IPL of the retina. D, Dorsal; R, rostral; L, lateral.
Figure 12.
Figure 12.
Quantitative paradigm for measuring reflexive eye movements in head-fixed, awake mice. A, Behavioral setup for measuring optokinetic nystagmus in mice. The mouse is head fixed to a post, surrounded by three screens presenting drifting gratings of defined spatial and temporal frequencies. The position of the eye is automatically tracked by a CCD camera and reference electrode. B, Sample image captured by a CCD camera used to record eye movements. The relative position of the pupil (white crosshatch) to a fixed reference point (green crosshatch) is measured. C, Example of grating stimulus presented in the temporal-to-nasal (forward) direction with respect to the recorded eye (right eye) of the mouse. D, Example trace of pupil displacement relative to the reference point during presentation of drifting gratings. E, Tuning curves of the gain (eye velocity/stimulus velocity) in response to two different spatial frequencies (gray, 0.16 cycles/°; black, 0.06 cycles/°). See Notes. F, Summary of the various DSGC subtypes described in this study and their central projections to the AOS. The view of the subcortical visual pathway (cortex removed) with the two optic nerves, the optic chiasm, and several of the non-AOS retinorecipient targets, including the SC shown in gray. The black arrow overlying the mouse represents the signals from the slow-velocity, forward-preferring On–Off DSCGs identified in this study. The projections of these DSGCs to the NOT and SC are shown on the brain schematic in black. Whether those cells also target the DTN is unknown; the DTN is too small to inject without encroaching on the SC. The On–DSGC inputs to other AOS targets are color coded as well. The tuning of the three types of On–DSGCs and their central projections are shown in red, green, and blue. The tuning preferences of target cells are derived from Yonehara et al. (2009) and from studies in rabbits (Simpson, 1984). Schematic design adapted from Pak et al. (1987).

Similar articles

Cited by

References

    1. Ackert JM, Wu SH, Lee JC, Abrams J, Hu EH, Perlman I, Bloomfield SA. Light-induced changes in spike synchronization between coupled ON direction selective ganglion cells in the mammalian retina. J Neurosci. 2006;26:4206–4215. doi: 10.1523/JNEUROSCI.0496-06.2006. - DOI - PMC - PubMed
    1. Amthor FR, Takahashi ES, Oyster CW. Morphologies of rabbit retinal ganglion cells with complex receptive fields. J Comp Neurol. 1989;280:97–121. doi: 10.1002/cne.902800108. - DOI - PubMed
    1. Barlow HB, Hill RM. Selective sensitivity to direction of movement in ganglion cells of the rabbit retina. Science. 1963;139:412–414. doi: 10.1126/science.139.3553.412. - DOI - PubMed
    1. Barlow HB, Hill RM, Levick WR. Retinal ganglion cells responding selectively to direction and speed of image motion in the rabbit. J Physiol. 1964;173:377–407. - PMC - PubMed
    1. Beier KT, Borghuis BG, El-Danaf RN, Huberman AD, Demb JB, Cepko CL. Transynaptic tracing with vesicular stomatitis virus reveals novel retinal circuitry. J Neurosci. 2013;33:35–51. doi: 10.1523/JNEUROSCI.0245-12.2013. - DOI - PMC - PubMed

Publication types

LinkOut - more resources