. 2013:2013:406342.
doi: 10.1155/2013/406342. Epub 2013 Oct 2.

A comparison of synonymous codon usage bias patterns in DNA and RNA virus genomes: quantifying the relative importance of mutational pressure and natural selection

Affiliations

A comparison of synonymous codon usage bias patterns in DNA and RNA virus genomes: quantifying the relative importance of mutational pressure and natural selection

Youhua Chen. Biomed Res Int. 2013.

Abstract

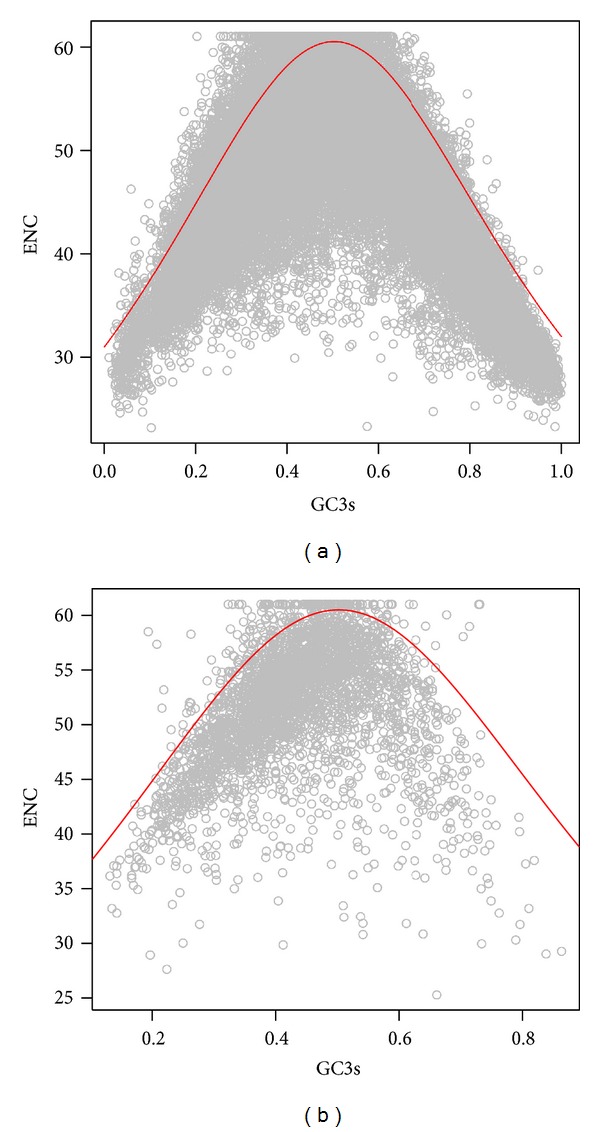
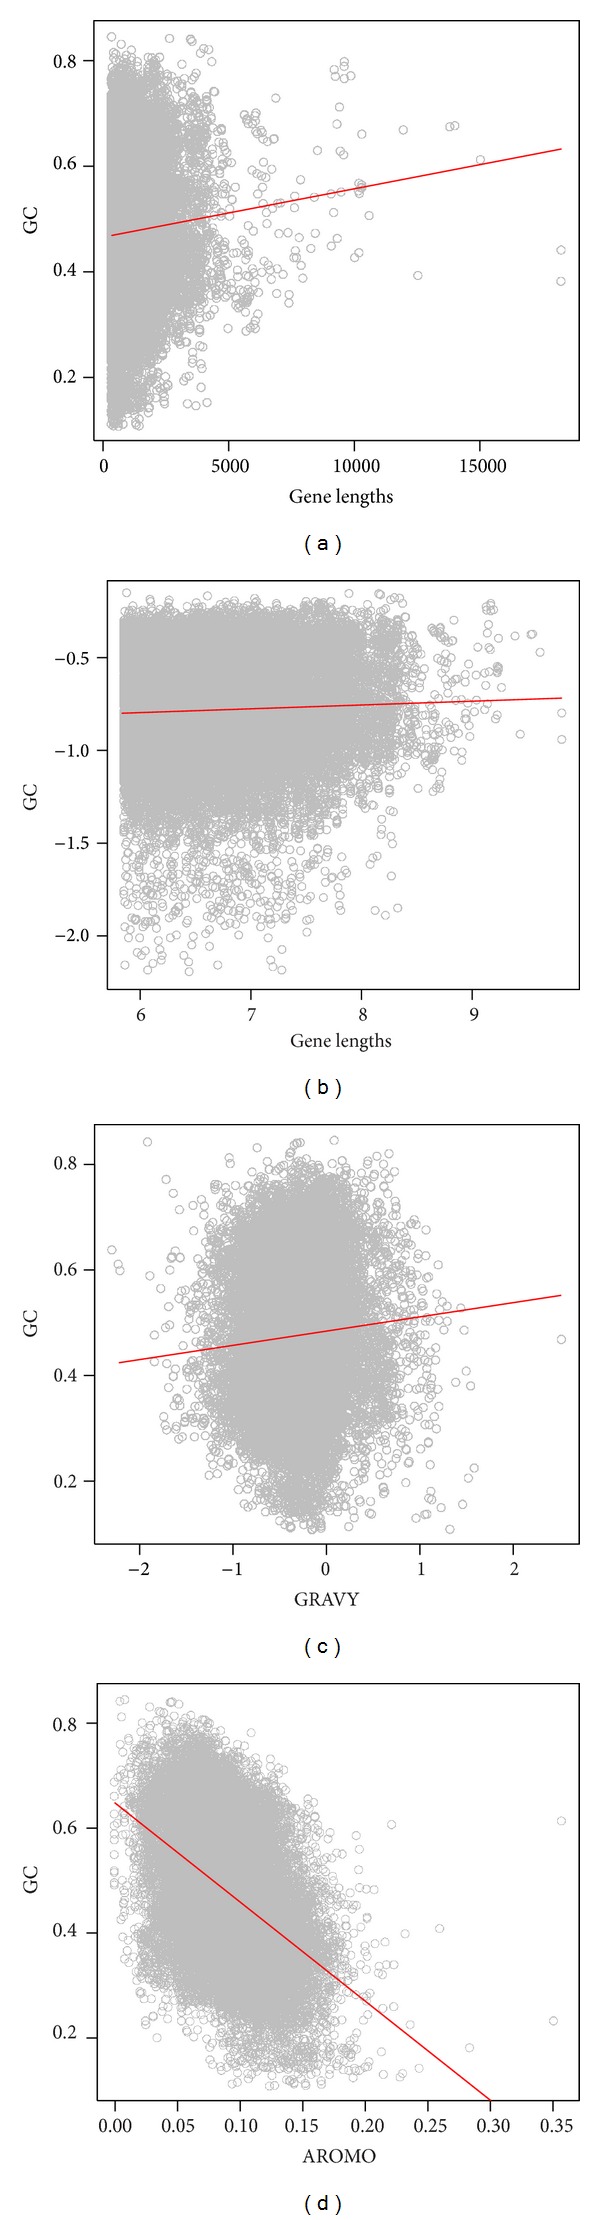
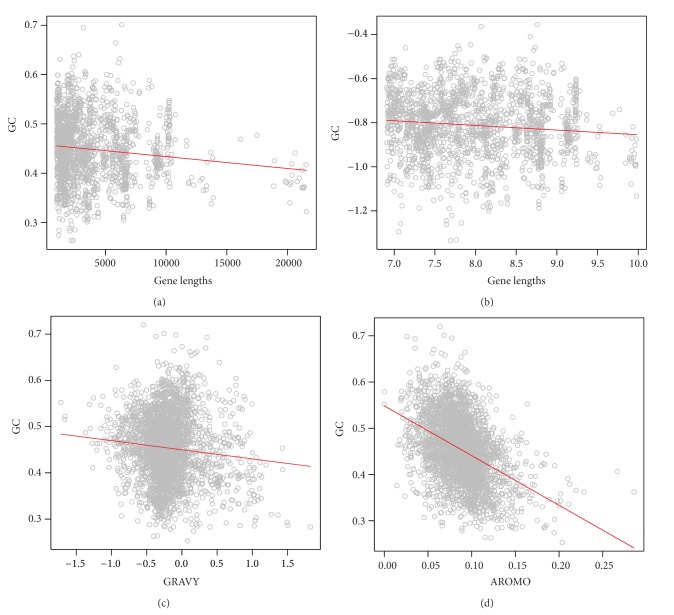
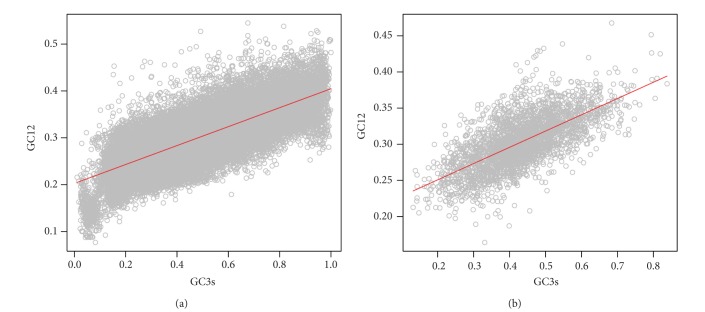
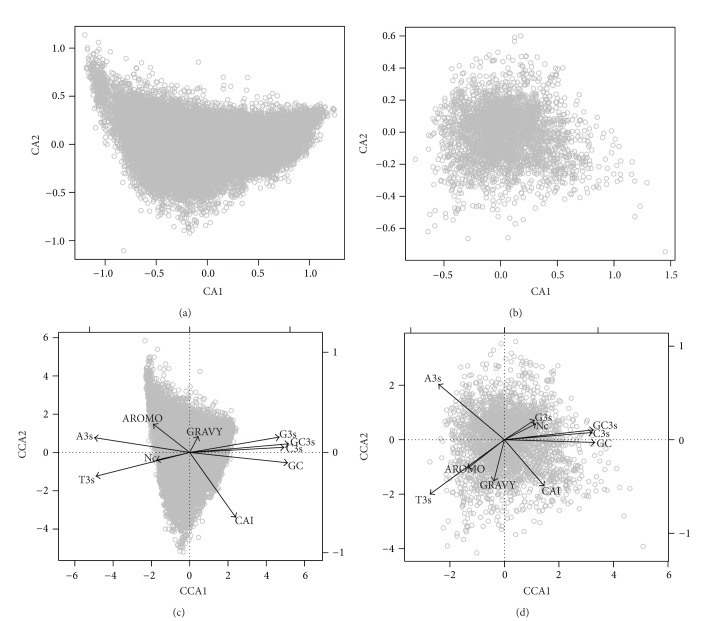
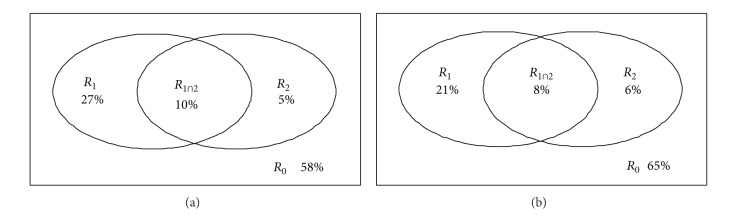
Codon usage bias patterns have been broadly explored for many viruses. However, the relative importance of mutation pressure and natural selection is still under debate. In the present study, I tried to resolve controversial issues on determining the principal factors of codon usage patterns for DNA and RNA viruses, respectively, by examining over 38000 ORFs. By utilizing variation partitioning technique, the results showed that 27% and 21% of total variation could be attributed to mutational pressure, while 5% and 6% of total variation could be explained by natural selection for DNA and RNA viruses, respectively, in codon usage patterns. Furthermore, the combined effect of mutational pressure and natural selection on influencing codon usage patterns of viruses is substantial (explaining 10% and 8% of total variation of codon usage patterns). With respect to GC variation, GC content is always negatively and significantly correlated with aromaticity. Interestingly, the signs for the significant correlations between GC, gene lengths, and hydrophobicity are completely opposite between DNA and RNA viruses, being positive for DNA viruses while being negative for RNA viruses. At last, GC12 versus G3s plot suggests that natural selection is more important than mutational pressure on influencing the GC content in the first and second codon positions.


Figures

Figure 1
Figure 1
The relationship between ENC and GC3s for DNA (a) and RNA (b) virus genomes, respectively.
Figure 2
Figure 2
The relationships between GC content, gene length, and amino acid properties for DNA viruses. (a) GC-gene length relationship without transformation: GC = 9.14E −06 × gene  lengths + 0.466  (R 2 = 0.003, P < 0.0001); (b) GC-gene length relationship with log-transformation: log⁡e(GC) = 0.021 × log⁡e(gene  lengths) − 0.921  (R 2 = 0.002, P < 0.0001); (c) GC-hydrophobicity relationship: GC = −0.027 × GRAVY + 0.484  (R 2 = 0.005, P < 0.0001); (d) GC-aromaticity relationship: GC = −1.89 × AROMO + 0.648  (R 2 = 0.19, P < 0.001).
Figure 3
Figure 3
The relationships between GC content, gene length, and amino acid properties for RNA viruses. (a) GC-gene length relationship without transformation: GC = −3.19E − 06 × gene  lengths + 0.463  (R 2 = 0.021, P < 0.0001); (b) GC-gene length relationship with log-transformation: log⁡e(GC) = −0.0227 × log⁡e(gene  lengths) − 0.629  (R 2 = 0.021, P < 0.001); (c) GC-hydrophobicity relationship: GC = −0.009 × GRAVY + 0.452  (R 2 = 0.01, P < 0.05); (d) GC-aromaticity relationship: GC = −1.154 × AROMO + 0.555  (R 2 = 0.159, P < 0.001).
Figure 4
Figure 4
The relationship between GC12 and GC3s of DNA (a) and RNA (b) virus genomes. The fitted regression line has the formula as GC12 = 0.202 × GC3s + 0.203  (R 2 = 0.461, P < 0.0001) for DNA viruses and GC12 = 0.225 × GC3s + 0.206  (R 2 = 0.461, P < 0.0001) for RNA viruses, respectively.
Figure 5
Figure 5
CA plots and CCA biplots for showing the major trends of codon usage patterns of the ORFs for DNA and RNA viruses. (a) CA plot for DNA viruses; (b) CA plot for RNA viruses; (c) CCA biplot for DNA viruses; (d) CCA biplot for RNA viruses.
Figure 6
Figure 6
Variation partitioning of codon usage patterns attributed to mutation and selection for DNA (a) and RNA (b) viruses. The meaning of each part of the variation is interpreted as follows, R 1: proportion of variation explained by mutation; R 2: proportion of variation explained by selection; R 1∩2: proportion of variation explained by the interaction of selection and mutation; R 0: proportion of unexplained variation.

References

    1. Archetti M. Codon usage bias and mutation constraints reduce the level of error minimization of the genetic code. Journal of Molecular Evolution. 2004;59(2):258–266. - PubMed
    1. Duret L, Mouchiroud D. Expression pattern and, surprisingly, gene length shape codon usage in Caenorhabditis, Drosophila, and Arabidopsis. Proceedings of the National Academy of Sciences of the United States of America. 1999;96(8):4482–4487. - PMC - PubMed
    1. Tao P, Dai L, Luo M, Tang F, Tien P, Pan Z. Analysis of synonymous codon usage in classical swine fever virus. Virus Genes. 2009;38(1):104–112. - PMC - PubMed
    1. Moriyama EN, Powell JR. Codon usage bias and tRNA abundance in Drosophila. Journal of Molecular Evolution. 1997;45(5):514–523. - PubMed
    1. Holmquist GP, Filipski J. Organization of mutations along the genome: a prime determinant of genome evolution. Trends in Ecology and Evolution. 1994;9(2):65–69. - PubMed

Publication types

LinkOut - more resources