

Etomidate produces similar allosteric modulation in α1β3δ and α1β3γ2L GABA(A) receptors
- PMID: 24199598
- PMCID: PMC3969089
- DOI: 10.1111/bph.12507
Etomidate produces similar allosteric modulation in α1β3δ and α1β3γ2L GABA(A) receptors
Abstract
Background and purpose: Neuronal GABA(A) receptors are pentameric chloride ion channels, which include synaptic αβγ and extrasynaptic αβδ isoforms, mediating phasic and tonic inhibition respectively. Although the subunit arrangement of αβγ receptors is established as β-α-γ-β-α, that of αβδ receptors is uncertain and possibly variable. We compared receptors formed from free α1, β3 and δ or γ2L subunits and concatenated β3-α1-δ and β3-α1 subunit assemblies (placing δ in the established γ position) by investigating the effects of R-(+)-etomidate (ETO), an allosteric modulator that selectively binds to transmembrane interfacial sites between β3 and α1.
Experimental approach: GABA-activated receptor-mediated currents in Xenopus oocytes were measured electrophysiologically, and ETO-induced allosteric shifts were quantified using an established model.
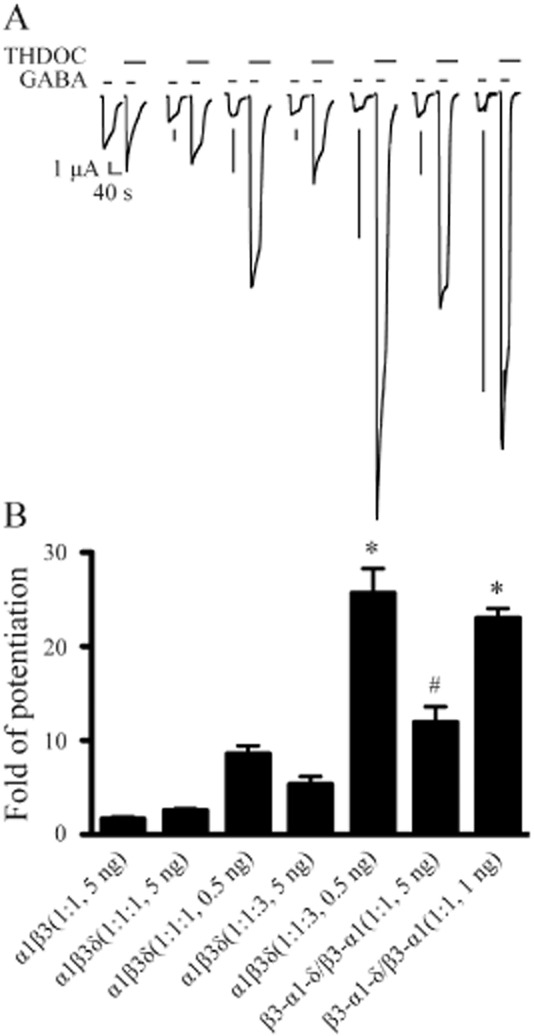
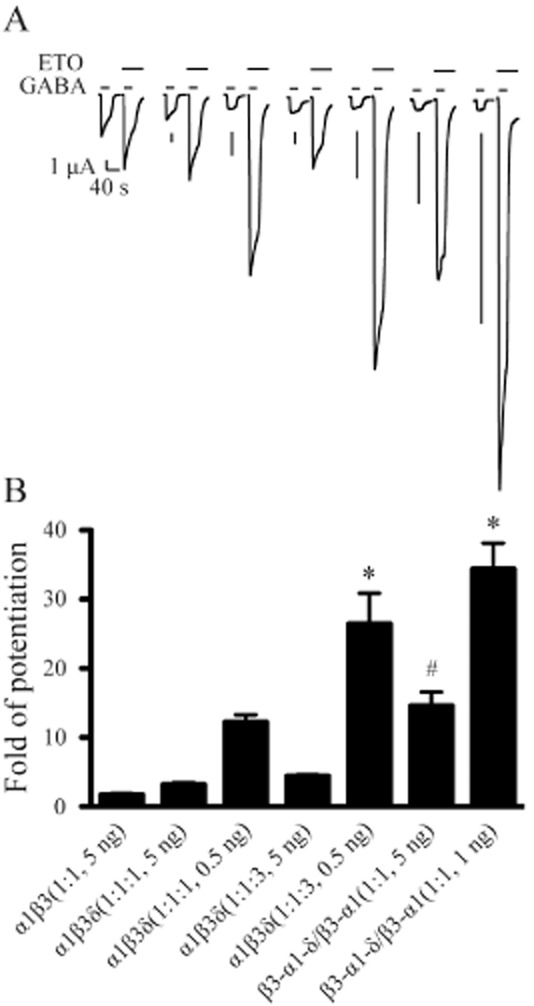
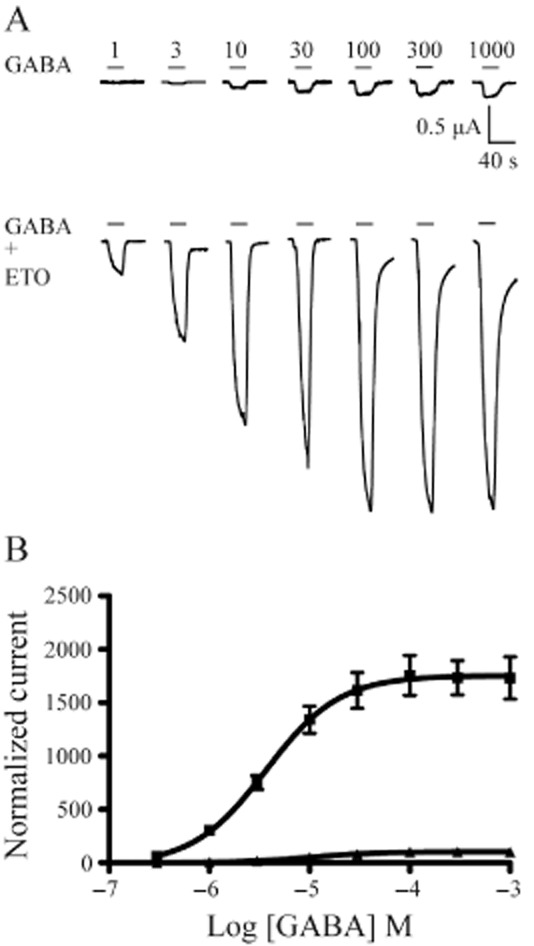
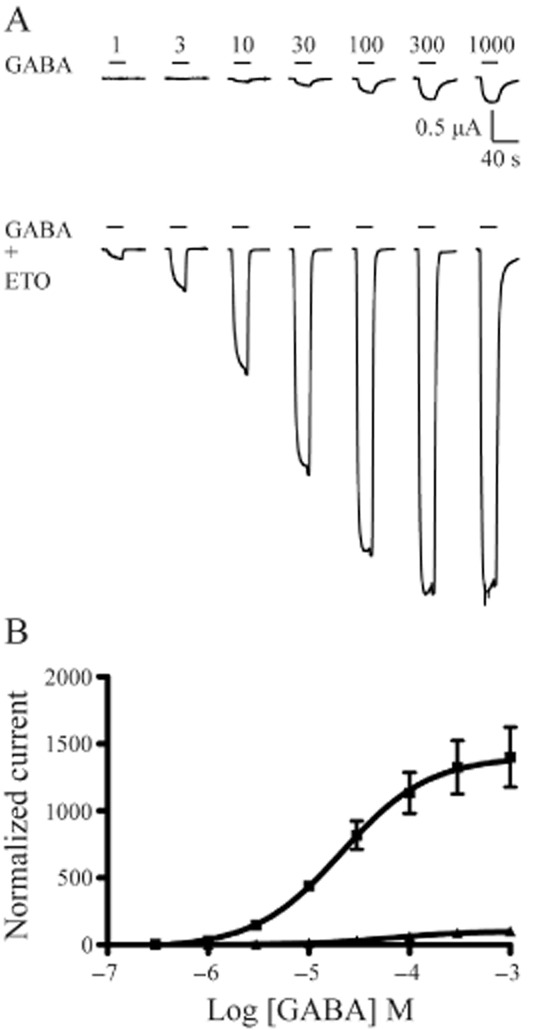
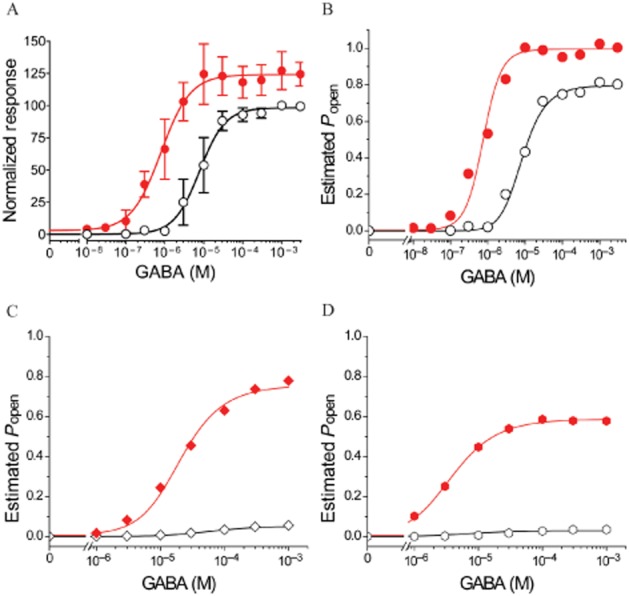
Key results: ETO (3.2 μM) similarly enhanced maximal GABA (1 mM)-evoked currents in oocytes injected with 5 ng total mRNA and varying subunit ratios, for α1β3(1:1), α1β3δ(1:1:1) and α1β3δ(1:1:3), but this potentiation by ETO was significantly greater for β3-α1-δ/β3-α1(1:1) receptors. Reducing the amount of α1β3δ(1:1:3) mRNA mixture injected (0.5 ng) increased the modulatory effect of ETO, matching that seen with β3-α1-δ/β3-α1(1:1, 1 ng). ETO similarly reduced EC₅₀s and enhanced maxima of GABA concentration-response curves for both α1β3δ and β3-α1-δ/β3-α1 receptors. Allosteric shift parameters derived from these data depended on estimates of maximal GABA efficacy, and the calculated ranges overlap with allosteric shift values for α1β3γ2L receptors.
Conclusion and implications: Reducing total mRNA unexpectedly increased δ subunit incorporation into receptors on oocyte plasma membranes. Our results favour homologous locations for δ and γ2L subunits in α1β3γ2/δ GABA(A) receptors.
Keywords: GABAA receptors; allosteric modulation; concatenated subunit assemblies; electrophysiology; etomidate; general anaesthetics; δ subunits.
© 2013 The British Pharmacological Society.
Figures
Similar articles
-
Etomidate uniquely modulates the desensitization of recombinant α1β3δ GABA(A) receptors.Neuroscience. 2015 Aug 6;300:307-13. doi: 10.1016/j.neuroscience.2015.05.051. Epub 2015 May 29. Neuroscience. 2015. PMID: 26028470 Free PMC article.
-
Comparison of αβδ and αβγ GABAA receptors: Allosteric modulation and identification of subunit arrangement by site-selective general anesthetics.Pharmacol Res. 2018 Jul;133:289-300. doi: 10.1016/j.phrs.2017.12.031. Epub 2017 Dec 30. Pharmacol Res. 2018. PMID: 29294355 Free PMC article. Review.
-
Barbiturates require the N terminus and first transmembrane domain of the delta subunit for enhancement of alpha1beta3delta GABAA receptor currents.J Biol Chem. 2010 Jul 30;285(31):23614-21. doi: 10.1074/jbc.M110.122564. Epub 2010 Jun 4. J Biol Chem. 2010. PMID: 20525684 Free PMC article.
-
Proton modulation of alpha 1 beta 3 delta GABAA receptor channel gating and desensitization.J Neurophysiol. 2004 Sep;92(3):1577-85. doi: 10.1152/jn.00285.2004. Epub 2004 May 19. J Neurophysiol. 2004. PMID: 15152020
-
Anesthetic sites and allosteric mechanisms of action on Cys-loop ligand-gated ion channels.Can J Anaesth. 2011 Feb;58(2):191-205. doi: 10.1007/s12630-010-9419-9. Epub 2011 Jan 7. Can J Anaesth. 2011. PMID: 21213095 Free PMC article. Review.
Cited by
-
The Direct Actions of GABA, 2'-Methoxy-6-Methylflavone and General Anaesthetics at β3γ2L GABAA Receptors: Evidence for Receptors with Different Subunit Stoichiometries.PLoS One. 2015 Oct 23;10(10):e0141359. doi: 10.1371/journal.pone.0141359. eCollection 2015. PLoS One. 2015. PMID: 26496640 Free PMC article.
-
General Anesthetic Binding Sites in Human α4β3δ γ-Aminobutyric Acid Type A Receptors (GABAARs).J Biol Chem. 2016 Dec 16;291(51):26529-26539. doi: 10.1074/jbc.M116.753335. Epub 2016 Nov 7. J Biol Chem. 2016. PMID: 27821594 Free PMC article.
-
How Do Modulators Affect the Orthosteric and Allosteric Binding Pockets?ACS Chem Neurosci. 2022 Apr 6;13(7):959-977. doi: 10.1021/acschemneuro.1c00749. Epub 2022 Mar 17. ACS Chem Neurosci. 2022. PMID: 35298129 Free PMC article.
-
Null method to estimate the maximal PA at subsaturating concentrations of agonist.J Gen Physiol. 2025 Jan 6;157(1):e202413644. doi: 10.1085/jgp.202413644. Epub 2024 Nov 25. J Gen Physiol. 2025. PMID: 39585302 Free PMC article.
-
Kavain, the Major Constituent of the Anxiolytic Kava Extract, Potentiates GABAA Receptors: Functional Characteristics and Molecular Mechanism.PLoS One. 2016 Jun 22;11(6):e0157700. doi: 10.1371/journal.pone.0157700. eCollection 2016. PLoS One. 2016. PMID: 27332705 Free PMC article.
References
-
- Barrera NP, Betts J, You H, Henderson RM, Martin IL, Dunn SM, et al. Atomic force microscopy reveals the stoichiometry and subunit arrangement of the α4β3δ GABAA receptor. Mol Pharmacol. 2008;73:960–967. - PubMed
Publication types
MeSH terms
Substances
Grants and funding
LinkOut - more resources
Full Text Sources
Other Literature Sources
