. 2013 Dec 11;135(49):18536-48.
doi: 10.1021/ja4086758. Epub 2013 Nov 26.

Ligand exchange and the stoichiometry of metal chalcogenide nanocrystals: spectroscopic observation of facile metal-carboxylate displacement and binding

Affiliations

Ligand exchange and the stoichiometry of metal chalcogenide nanocrystals: spectroscopic observation of facile metal-carboxylate displacement and binding

Nicholas C Anderson et al. J Am Chem Soc. .

Abstract

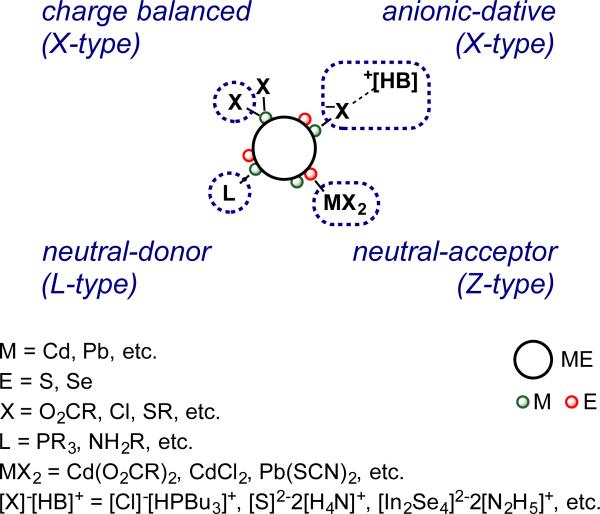
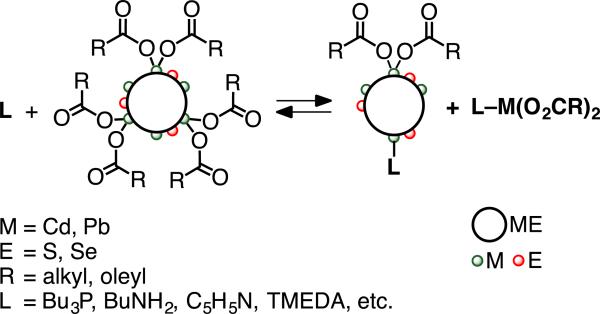
We demonstrate that metal carboxylate complexes (L-M(O2CR)2, R = oleyl, tetradecyl, M = Cd, Pb) are readily displaced from carboxylate-terminated ME nanocrystals (ME = CdSe, CdS, PbSe, PbS) by various Lewis bases (L = tri-n-butylamine, tetrahydrofuran, tetradecanol, N,N-dimethyl-n-butylamine, tri-n-butylphosphine, N,N,N',N'-tetramethylbutylene-1,4-diamine, pyridine, N,N,N',N'-tetramethylethylene-1,2-diamine, n-octylamine). The relative displacement potency is measured by (1)H NMR spectroscopy and depends most strongly on geometric factors such as sterics and chelation, although also on the hard/soft match with the cadmium ion. The results suggest that ligands displace L-M(O2CR)2 by cooperatively complexing the displaced metal ion as well as the nanocrystal. Removal of up to 90% of surface-bound Cd(O2CR)2 from CdSe and CdS nanocrystals decreases the Cd/Se ratio from 1.1 ± 0.06 to 1.0 ± 0.05, broadens the 1S(e)-2S(3/2h) absorption, and decreases the photoluminescence quantum yield (PLQY) from 10% to <1% (CdSe) and from 20% to <1% (CdS). These changes are partially reversed upon rebinding of M(O2CR)2 at room temperature (∼60%) and fully reversed at elevated temperature. A model is proposed in which electron-accepting M(O2CR)2 complexes (Z-type ligands) reversibly bind to nanocrystals, leading to a range of stoichiometries for a given core size. The results demonstrate that nanocrystals lack a single chemical formula, but are instead dynamic structures with concentration-dependent compositions. The importance of these findings to the synthesis and purification of nanocrystals as well as ligand exchange reactions is discussed.


Figures

Figure 1
Figure 1
(A) Vinyl region of the 1H NMR spectrum of carboxylate-terminated CdSe nanocrystals shows displacement of Cd(O2CR)2 on treatment with increasing concentrations of TMEDA. (B) 1H NMR spectrum of purified CdSe nanocrystals with chemical shift assignments. (*) Sharp signal at δ = 4.1 ppm is ferrocene standard used to measure oleyl concentration (See Experimental). Changes to the chemical shifts of both free and bound signals at high concentration of TMEDA may be due to a change in the dielectric of the solvent medium. The final 2M concentration is ~20% by volume TMEDA. Similarly, as an increasing amount of Cd(O2CR)2 is removed from the nanocrystal, the density of aliphatic ligands changes as does their local dielectric medium.
Figure 2
Figure 2
(A) FT-IR spectra of (Bu3P)Cd(O2CR)2 (R = oleyl and tridecyl) isolated from CdSe nanocrystals after exposure to Bu3P (blue, bottom); an independently prepared cadmium oleate plus Bu3P (red, middle); a mixture of oleic acid and Bu3P (green, top). A small concentration of carboxylic acid 1720 cm−1 is present in the (Bu3P)Cd(O2CR)2 isolated from nanocrystals (see below). (B) 31P (top) and 1H (bottom) NMR spectra of (Bu3P)Cd(O2CR)2 (R = oleyl and tridecyl) isolated from CdSe nanocrystals. The broad resonance at δ = 13.7 ppm has been magnified 20x and corresponds to an acid impurity (~8%). Top inset shows the 31P chemical shift is downfield from the signal of free Bu3P (δ = −17 vs. −31 ppm). Furthermore, the resonance shifts further downfield as the concentration increses, perhaps due to the presence of cadmium complexes with multiple phosphine ligands in rapid exchange. Both the ratio of phospine and carboxylate signals in the 1H NMR spectrum and the chemical shift of an authentic sample (Figure S4) indicate the isolated sample is a monophosphine complex. (C) Cadmium (3d) XPS spectrum of isolated (Bu3P)Cd(O2CR)2. (D) XPS spectrum of (Bu3P)Cd(O2CR)2 from the binding energy region characteristic of selenium (3p) shows no signal.
Figure 3
Figure 3
(A) Temporal evolution of (κ2-TMEDA)Cd(O2CR)2 displacement as measured by 1H NMR spectroscopy at several concentrations of added TMEDA in d6-benzene. (B) 1H NMR spectra of the vinyl region after 200 minutes of reaction. Colors correspond to 0.02 M (blue, diamonds), 0.21 M (red, squares), and 1.65 M (green, triangles) TMEDA solutions. Error bars are set to 10% reflects error in the integration of 1H NMR spectra (see experimental).
Figure 4
Figure 4
Dependence of photoluminescence quantum yield on carboxylate coverage. Empty red shapes taken from in situ measurements using the neutral donors shown in Scheme 3. L-type ligands were added to a stock solution of CdSe nanocrystals (0.02 M in O2CR) to a total concentration of 0.02 M (squares), 0.2 M (diamonds) and 2.0 M (triangles) (see experimental). Filled circles correspond to samples where the coverage was measured after isolation following displacement (blue) or rebinding (green) of Cd(O2CR)2. See supplemental for additional detail.
Figure 5
Figure 5
Absorption (red, solid) and photoluminescence (blue, dashed) spectra of CdSe (A-C) and CdS (D-F) nanocrystals. CdSe nanocrystals: Purified after synthesis (A), isolated after treatment with TMEDA (B), and after rebinding Cd(O2CR)2 at room temperature (C). Gray spectra in Box C show absorption (solid) and photoluminescence (dashed) after heating at 240° C for 1 hr with added Cd(O2CR)2 and oleic acid. CdS nanocrystals: As synthesized, before purification (D), isolated after treatment with TMEDA (E), and after Cd(O2CR)2 rebinding at room temperature (F).
Scheme 1
Scheme 1
Nanocrystal ligand binding motifs as classified by the L,X,Z, formalism. Depictions of nanocrystal chemical formulas do not imply geometric structure.
Scheme 2
Scheme 2
Example surface ligand modifications of metal chalcogenide nanocrystals including X-, L-, and Z-type exchange (A) and Z-type ligand displacement (B).
Scheme 3
Scheme 3
Displacement of L-M(O2CR)2 from metal chalcogenide nanocrystals promoted by L-type ligands. Depictions of nanocrystal chemical formulas do not imply geometric structure.
Scheme 4
Scheme 4
Relative displacement potency labeled with the percentage of L-Cd(O2CR)2 displaced in a 2.0 M solution of the of L-type ligand.

References

    1. Kamat PV. J. Phys. Chem. C. 2008;112:18737–18753.
    1. Kramer IJ, Sargent EH. ACS Nano. 2011;5:8506–8514. - PubMed
    1. Talapin DV, Lee JS, Kovalenko MV, Shevchenko EV. Chem. Rev. 2010;110:389–458. - PubMed
    1. Tang JA, Sargent EH. Adv. Mater. 2011;23:12–29. - PubMed
    1. Wuister SF, Swart I, Driel FV, Hickey SG, Donega CDM. Nano Lett. 2003;3:503–507.

Publication types