. 2013 Nov 7;14(11):R123.
doi: 10.1186/gb-2013-14-11-r123.

Metabolic reprogramming by viruses in the sunlit and dark ocean

Metabolic reprogramming by viruses in the sunlit and dark ocean

Bonnie L Hurwitz et al. Genome Biol. .

Abstract

Background: Marine ecosystem function is largely determined by matter and energy transformations mediated by microbial community interaction networks. Viral infection modulates network properties through mortality, gene transfer and metabolic reprogramming.

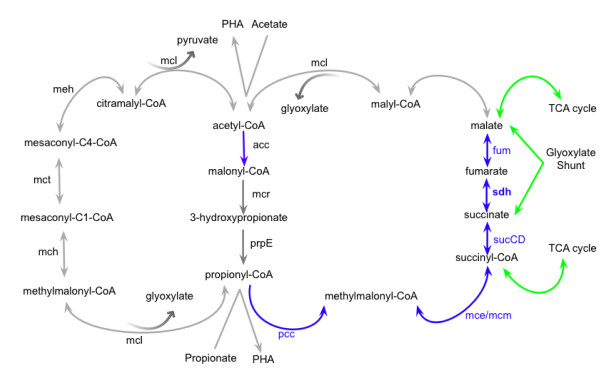
Results: Here we explore the nature and extent of viral metabolic reprogramming throughout the Pacific Ocean depth continuum. We describe 35 marine viral gene families with potential to reprogram metabolic flux through central metabolic pathways recovered from Pacific Ocean waters. Four of these families have been previously reported but 31 are novel. These known and new carbon pathway auxiliary metabolic genes were recovered from a total of 22 viral metagenomes in which viral auxiliary metabolic genes were differentiated from low-level cellular DNA inputs based on small subunit ribosomal RNA gene content, taxonomy, fragment recruitment and genomic context information. Auxiliary metabolic gene distribution patterns reveal that marine viruses target overlapping, but relatively distinct pathways in sunlit and dark ocean waters to redirect host carbon flux towards energy production and viral genome replication under low nutrient, niche-differentiated conditions throughout the depth continuum.

Conclusions: Given half of ocean microbes are infected by viruses at any given time, these findings of broad viral metabolic reprogramming suggest the need for renewed consideration of viruses in global ocean carbon models.


Figures

Figure 1
Figure 1
Taxonomic distribution of viral metagenomic read hits to small subunit 16S ribosomal DNA and carbon metabolism genes by bacterial order. 16S hits are noted in red and carbon metabolism gene hits are noted in black. Samples and metadata are further described by Hurwitz and Sullivan [21].
Figure 2
Figure 2
Representative contigs containing carbon metabolism genes. Example contigs containing carbon metabolism shown in blue, in context with other genes shown in black. Genes are colored based on superkingdom annotation: red, viral; light red, bacterial; pink, no superkingdom.
Figure 3
Figure 3
Metabolic map of virus-encoded carbon metabolism host genes from 12 viromes in sunlit Pacific Ocean waters. Red lines represent genes encoded in the photic zone. The width of the lines corresponds to the normalized read abundance as shown in the legend, and arrows correspond to the proposed flow through these pathways during viral infection. Enzymes are listed in red and compounds in black. (A) Virus-encoded host genes in glycolysis, fatty acid metabolism, the pentose phosphate pathway, and the Entner-Doudoroff pathway towards dNTP biosynthesis. (B) Virus-encoded host genes in glycolysis, fatty acid metabolism, the tricarboxylic acid (TCA) cycle, the electron transport chain, and components of the 3-hydroxypropionate Bicycle towards energy production. For map generation, see iPath [40].
Figure 4
Figure 4
Overview of Pacific Ocean Virome (POV)-encoded 3-hydroxypropionate Bicycle enzymes. Enzyme names are listed as in Additional file 5: Table S3. The figure complements and highlights the pathways shown in Figures  3 and 5. The enzyme acc can also play a role in fatty acid metabolism.
Figure 5
Figure 5
Metabolic map of virus-encoded carbon metabolism host genes from 10 viromes in dark Pacific Ocean waters. Blue lines represent genes encoded in the aphotic zone. The width of the lines corresponds to the normalized read abundance as shown in the legend and arrows correspond to the proposed flow through these pathways during viral infection. Enzymes are listed in blue and compounds in black. (A) Virus-encoded host genes in glycolysis, fatty acid metabolism, the pentose phosphate pathway, and the Entner-Doudoroff pathway towards dNTP biosynthesis. (B) Virus-encoded host genes in glycolysis, fatty acid metabolism, the tricarboxylic acid (TCA) cycle, the electron transport chain, and components of the 3-hydroxypropionate Bicycle towards energy production. For map generation, see iPath [40].

References

    1. Falkowski PG, Barber RT, Smetacek V. Biogeochemical controls and feedbacks on ocean primary production. Science. 1998;14:200–207. - PubMed
    1. Kasting JF, Siefert JL. Life and the evolution of Earth’s atmosphere. Science. 2002;14:1066–1068. - PubMed
    1. Faust K, Raes J. Microbial interactions: from networks to models. Nat Rev Microbiol. 2012;14:538–550. - PubMed
    1. Wright JJ, Konwar KM, Hallam SJ. Microbial ecology of expanding oxygen minimum zones. Nat Rev Microbiol. 2012;14:381–394. - PubMed
    1. Breitbart M, Thompson LR, Suttle CA, Sullivan MB. Exploring the vast diversity of marine viruses. Oceanography. 2007;14:135–139.

Publication types