

doi: 10.1186/gb-2013-14-11-r124.
AHT-ChIP-seq: a completely automated robotic protocol for high-throughput chromatin immunoprecipitation
- PMID: 24200198
- PMCID: PMC4053851
- DOI: 10.1186/gb-2013-14-11-r124
Item in Clipboard
AHT-ChIP-seq: a completely automated robotic protocol for high-throughput chromatin immunoprecipitation
Genome Biol.
.
Abstract
ChIP-seq is an established manually-performed method for identifying DNA-protein interactions genome-wide. Here, we describe a protocol for automated high-throughput (AHT) ChIP-seq. To demonstrate the quality of data obtained using AHT-ChIP-seq, we applied it to five proteins in mouse livers using a single 96-well plate, demonstrating an extremely high degree of qualitative and quantitative reproducibility among biological and technical replicates. We estimated the optimum and minimum recommended cell numbers required to perform AHT-ChIP-seq by running an additional plate using HepG2 and MCF7 cells. With this protocol, commercially available robotics can perform four hundred experiments in five days.
Figures
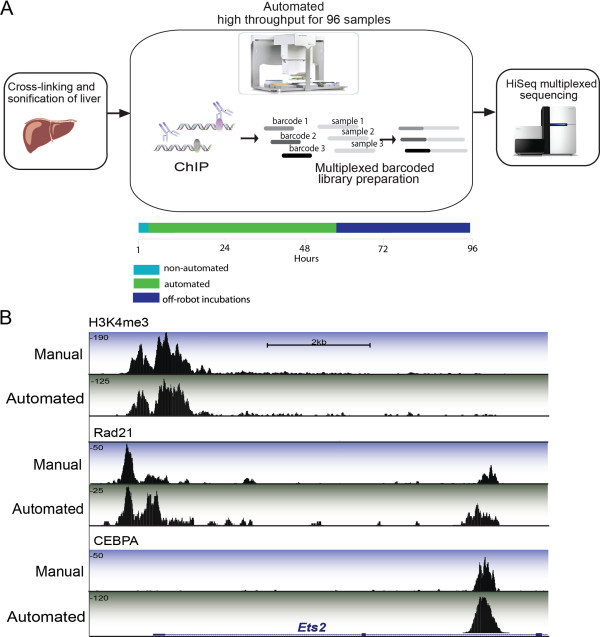
Schematic of automatic high throughput ChIP-seq protocol and representative data. (A) Primary tissues were isolated and treated with formaldehyde to crosslink protein-DNA contacts. Sonicated lysate was then transferred to an Agilent workstation where it was added to prepared antibody-bound magnetic beads. Wash steps and purification took place on the Agilent workstation. Illumina library preparation took place on separate automated liquid handling system (Beckman) with subsequent HiSeq2000 sequencing. (B) Representation from the UCSC genome browser: a 10 kb region surrounding the Ets2 gene on mouse chromosome 16. DNA binding regions for three factors are shown: CEBPA, RAD21 and H3K4me3. Tracks with a blue background highlight data acquired from our own previously published manual ChIP-seq experiments. Tracks with green background highlight AHT-ChIP-seq data. The height of each track (y-axis) corresponds with uncorrected read depth. Beneath the enrichment track is the RefSeq genome annotation.
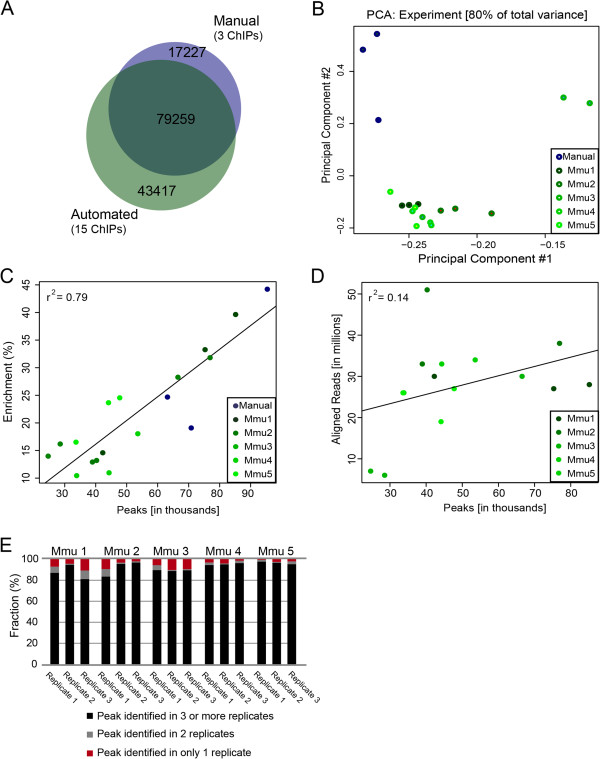
Comparison of inter-replicate data including our own previously published manual ChIP-seq datasets for CEBPA. (A) Proportional Venn diagram displaying overlap from the union of peak-sets from published manual data and AHT-ChIP-seq for CEBPA. (B) Principal component analysis with automated ChIP-seq data sets (greens) and manual data set (blue). (C) Scatter plot of percent enrichment (y-axis) versus number of peaks identified by MACS (x-axis). The Pearson correlation is shown in the upper left corner. AHT-ChIP-seq data sets are indicated in green shades, and manual data sets in blue. (D) Scatter plot of aligned reads from the automated ChIP-seq data (y-axis) versus number of peaks identified by MACS (x-axis). Pearson correlation in upper left corner. (E) Fraction of unique peaks for each replicate and those that are represented across multiple experiments. Peaks that occur in only one replicate are shown in red, those that occur in at least two replicates in grey, and those which occur in at least three triplicates in black. Mmu1 to Mmu5 refer to biologically individual mice (Mus musculus).
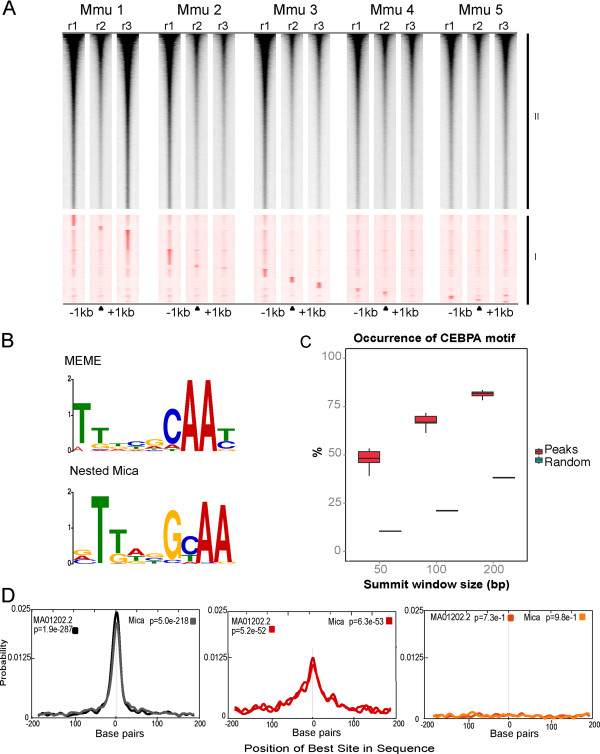
Many private and low density peaks are real CEBPA binding events. (A) Heat map of sequence tag density, a one kilobase pair window either side of the center of the peak. The data were then split into two groups, group I (red) contains those peaks that only occurred in one replicate (n = 41,229); Group II (black) contains those peaks that occurred in any two replicates (n = 81,520). Group I peaks are the 15 subsets of replicate unique peaks ordered by Mmu1_r1 unique peaks (top) to Mmu5_r3 (bottom). Group II peaks are ordered by occupancy. (B)De novo motif analyses using MEME and NestedMica software were able to determine a consensus DNA sequence for CEBPA. (C) Fractions of peaks (as determined by MACS) containing a CEBPA motif were calculated across all replicates and within all peaks using NestedMica for three summit window sizes: 50, 100 and 200 bp. These were compared with multiple iterations of random sequences using the same summit window sizes. (D) For the top 1,000 occupied peaks that occur in multiple replicates (black) and the bottom 1,000 occupied peaks identified in only one replicate (red), both derived consensus motifs were found to be significantly represented in both bins using CentriMo analysis software. A random set of 1,000 genomic intervals of equal size are shown for comparison (orange).
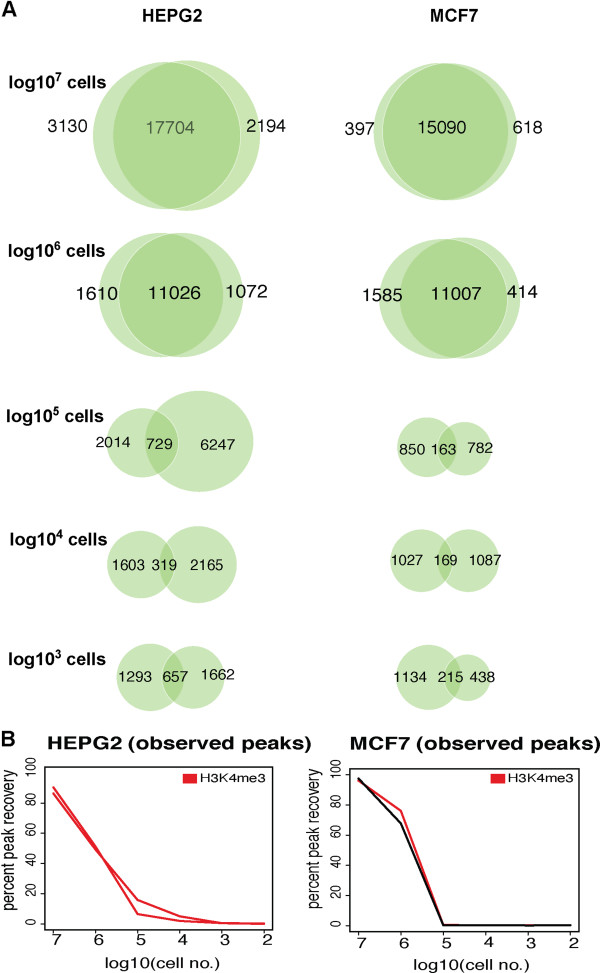
Titration to ascertain optimum cell number for use in AHT-ChIP-seq experiments. (A) Proportional Venn diagrams show the overlap of peaks between duplicate experiments for a titration curve of cell number for H3K4me3 in HepG2 and MCF7 cell lines, with highest cell number being log107 and the lowest cell number being log103. No ChIP enrichment was observed for less than 1,000 cells. (B) Line graphs showing percentage peak recovery for titration of cell number, with cell number shown as log10 scale with highest cell number being 10 million.
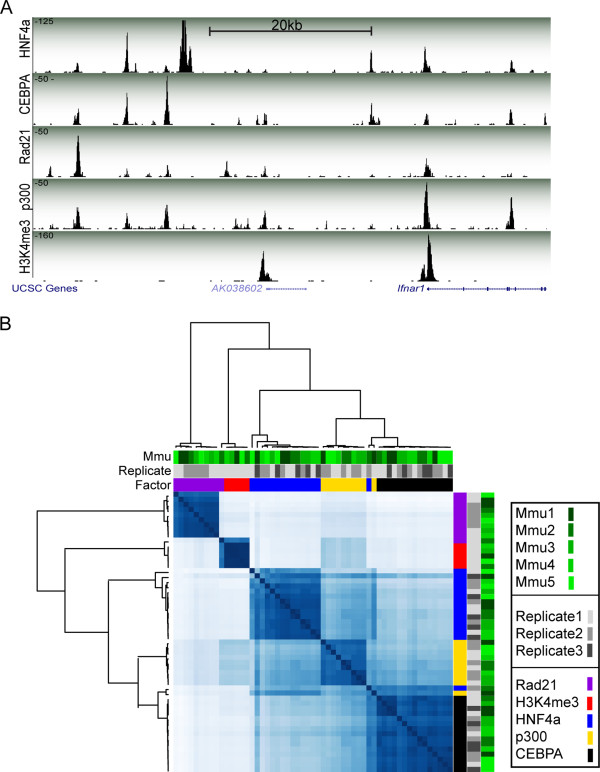
AHT-ChIP-seq can be used to simultaneously map multiple levels of transcriptional control. (A) Representation from UCSC genome browser, a 50 kb region around the non-coding RNA AK038602 on mouse chromosome 16. Data generated by AHT-ChIP-seq for five DNA binding regions are shown: HNF4A, CEBPA, RAD21, p300 and H3K4me3. The height of each track (y-axis) corresponds with sequence read depth. Beneath the enrichment track is the RefSeq genome annotation. (B) Correlation heat map based on peak location identified by MACS, with three layers of annotation: biological replicate (greens), technical replicate identification (greys) and factors: RAD21 (purple), H3K4me3 (red), HNF4A (blue), p300 (yellow) and CEBPA (black).
References
-
- Zhu J, Adli M, Zou JY, Verstappen G, Coyne M, Zhang X, Durham T, Miri M, Deshpande V, De Jager PL, Bennett DA, Houmard JA, Muoio DM, Onder TT, Camahort R, Cowan CA, Meissner A, Epstein CB, Shoresh N, Bernstein BE. Genome-wide chromatin state transitions associated with developmental and environmental cues. Cell. 2013;14:642–654. doi: 10.1016/j.cell.2012.12.033. - DOI - PMC - PubMed
Publication types
MeSH terms
Grants and funding
LinkOut - more resources
Full Text Sources
Other Literature Sources
