. 2014 Aug;18(6):866-80.
doi: 10.1016/j.media.2013.09.008. Epub 2013 Oct 17.

Improving low-dose blood-brain barrier permeability quantification using sparse high-dose induced prior for Patlak model

Affiliations

Improving low-dose blood-brain barrier permeability quantification using sparse high-dose induced prior for Patlak model

Ruogu Fang et al. Med Image Anal. 2014 Aug.

Abstract

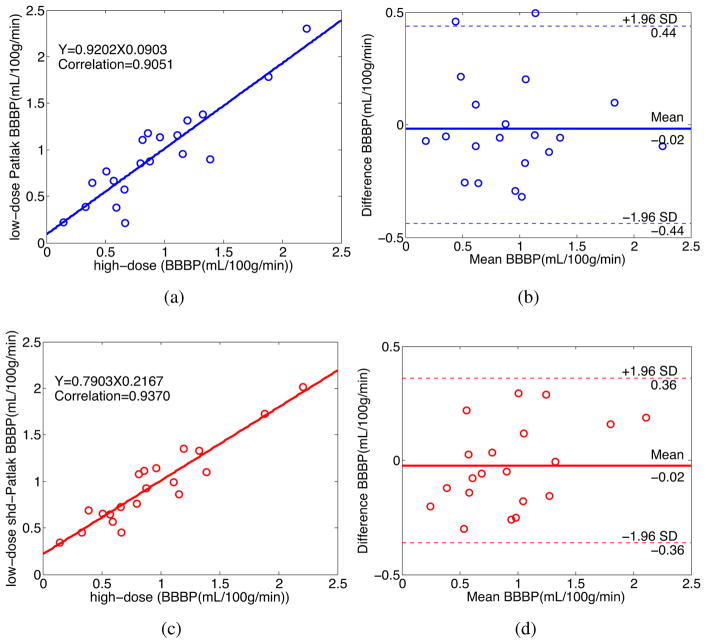
Blood-brain barrier permeability (BBBP) measurements extracted from the perfusion computed tomography (PCT) using the Patlak model can be a valuable indicator to predict hemorrhagic transformation in patients with acute stroke. Unfortunately, the standard Patlak model based PCT requires excessive radiation exposure, which raised attention on radiation safety. Minimizing radiation dose is of high value in clinical practice but can degrade the image quality due to the introduced severe noise. The purpose of this work is to construct high quality BBBP maps from low-dose PCT data by using the brain structural similarity between different individuals and the relations between the high- and low-dose maps. The proposed sparse high-dose induced (shd-Patlak) model performs by building a high-dose induced prior for the Patlak model with a set of location adaptive dictionaries, followed by an optimized estimation of BBBP map with the prior regularized Patlak model. Evaluation with the simulated low-dose clinical brain PCT datasets clearly demonstrate that the shd-Patlak model can achieve more significant gains than the standard Patlak model with improved visual quality, higher fidelity to the gold standard and more accurate details for clinical analysis.

Keywords: Blood–brain barrier permeability; Patlak model; Radiation dose reduction; Sparse high-dose induced prior.


Figures

Figure 1
Figure 1
The flowchart of the low-dose map enhancement framework which consists of three modules: location adaptive dictionary construction, sparsity imposed prior estimation and MAP optimization. Using the high-dose repository, high-quality parameter maps are computed as training data from which we are able to construct location adaptive dictionaries. Then an iterative process consisting of prior estimation and MAP optimization is applied to enhance the low-dose map.
Figure 2
Figure 2
Construction of location adaptive dictionaries for a low-dose map P (red) from the high-dose repository (blue). Search bounding box is adaptively determined for each patch P (such as the purple box pi or the orange box pj) by using the location of the current patch as reference. After determining the bounding box (dashed line Si and Sj) for the current patch, a certain number of patches across different training samples are selected into the dictionary D.
Figure 3
Figure 3
Cerebral BBBP maps computed by different methods from simulated low-dose PCT data at different exposure levels (mAs). The 1st column is the BBBP map estimated from high-dose 190 mA data (gold standard). The 2nd column is the BBBP maps estimated using Patlak model at simulated low-dose. Dose reduction, achieved through tube current reduction, primarily results in increased image noise, demonstrated as increased “graininess” in the map of the simulated low-dose scan. The 3rd column is the enhanced low-dose BBBP maps using shd-Patlak model. The 1st row is at tube current 50 mA (σG = 12.51), 2nd row at 25 mA (σG = 17.27), and 3rd row at 15 mA (σG = 25.54). The display window option: width is 5 HU, level is 2.5 HU. (Color image)
Figure 4
Figure 4
Vertical profiles of the BBBP map at high-dose and simulated at tube current of 15 mA in Fig. 3 at (a) x=320 using Patlak model, (b) x=320 using shd-Patlak model, (c) x=220 using Patlak model and (d) x=220 using shd-Patlak model. Profile between y=101 and 420 is shown and used for quantitative evaluation. The ‘dash line’ is from Patlak model or the shd-Patlak model. The ‘solid line’ is from the high-dose map which acts as the ground-truth for comparison.
Figure 5
Figure 5
BBBP maps of 3 patients calculated from the different brain PCT images. Every row contains BBBP maps of one patient at different exposure and computation methods. The first column was calculated from the high-dose 190 mA images using Patlak model (the gold standard); the second and third columns were calculated from the simulated low-dose images by the Patlak model and the shd-Patlak model, respectively. The radiation dose in the low-dose data simulated is 15 mA, which equals to a 92% reduction of radiation exposure compared to the high-dose. Three ROIs of size 50 × 50 pixels are selected for all patients and quantitative evaluation is shown in Section 6.4. ROI2 is enlarged and displayed on the lower right corner of the maps. The first two patients are normal, while the third patient has brain deficit in the right middle cerebral artery (RMCA).
Figure 6
Figure 6
Zoomed regions of the BBBP maps shown in Fig. 5. The first column was calculated from the high-dose 190 mA images using Patlak model (the gold standard); the second and third columns were calculated from the simulated low-dose images by the Patlak model and the shd-Patlak model, respectively. The radiation dose in the low-dose data simulated is 15 mA, which equals to a 92% reduction of radiation exposure compared to the high-dose. The arrows highlight the tissue and blood vessels which are enhanced in the simulated low-dose maps.
Figure 7
Figure 7
The correlation (left column) and Bland-Altman plot (right column) between the BBBP values computed from the high-dose images and the low-dose images by different methods for the patient in the second row in Fig. 5. Plots (a) and (b) represent the results obtained from the high-and low-dose by the Patlak model. Plots (c) and (d) represent the corresponding results obtained from the high- and low-dose by the shd-Patlak model.
Figure 8
Figure 8
The correlation (left column) and Bland-Altman plot (right column) between the BBBP values computed from the high-dose images and the low-dose images by different methods for the patient in the third row in Fig. 5. Plots (a) and (b) represent the results obtained from the high- and low-dose by the Patlak model. Plots (c) and (d) represent the corresponding results obtained from the high- and low-dose by the shd-Patlak model.
Figure 9
Figure 9
BBBP maps of Patient No. 8 at different experimental settings. (a) A frame from the PCT data of Patient 8, who has RACA deficit due to ventriculostomy catheter and the blood in the brain vessel flows into the skull. (b) Map calculated using Patlak model at 190 mA. (c) Map calculated using Patlak model at 15 mA. (d) Map calculated using shd-Patlak model at 15 mA and trained on deficit cases. (e) Map calculated using shd-Patlak model at 15 mA and trained on normal cases. Left and right middle cerebral arteries (LMCA and RMCA) are enlarged below the map.
Figure 10
Figure 10
Convergence rate and parameter sensitivity of patch size, search window size, training samples per image, λ and β. A set of parameter values is tested. The cost function drops fast and usually converges after 2 or 3 iterations. Generally the performance is stable and the optimum values are chosen in the following experiments.

Similar articles

Cited by

References

    1. Andersen I, Szymkowiak A, Rasmussen C, Hanson L, Marstrand J, Larsson H, Hansen L. Perfusion quantification using Gaussian process deconvolution. Magnetic Resonance in Medicine. 2002;48:351–361. - PubMed
    1. Badea CT, Johnston SM, Qi Y, Johnson GA. 4D micro-CT for cardiac and perfusion applications with view under sampling. Physics in medicine and biology. 2011;56:3351. - PMC - PubMed
    1. Bisdas S, Hartel M, Cheong L, Koh T, Vogl T. Prediction of subsequent hemorrhage in acute ischemic stroke using permeability CT imaging and a distributed parameter tracer kinetic model. Journal of neuroradiology. 2007;34:101–108. - PubMed
    1. Britten A, Crotty M, Kiremidjian H, Grundy A, Adam E. The addition of computer simulated noise to investigate radiation dose and image quality in images with spatial correlation of statistical noise: an example application to X-ray CT of the brain. British journal of radiology. 2004;77:323–328. - PubMed
    1. Calamante F, Gadian D, Connelly A. Quantification of bolus-tracking MRI: Improved characterization of the tissue residue function using Tikhonov regularization. Magnetic resonance in medicine. 2003;50:1237–1247. - PubMed

Publication types

MeSH terms