. 2014 Jan 23;123(4):570-81.
doi: 10.1182/blood-2013-10-530683. Epub 2013 Nov 7.

Global discovery of erythroid long noncoding RNAs reveals novel regulators of red cell maturation

Affiliations

Global discovery of erythroid long noncoding RNAs reveals novel regulators of red cell maturation

Juan R Alvarez-Dominguez et al. Blood. .

Abstract

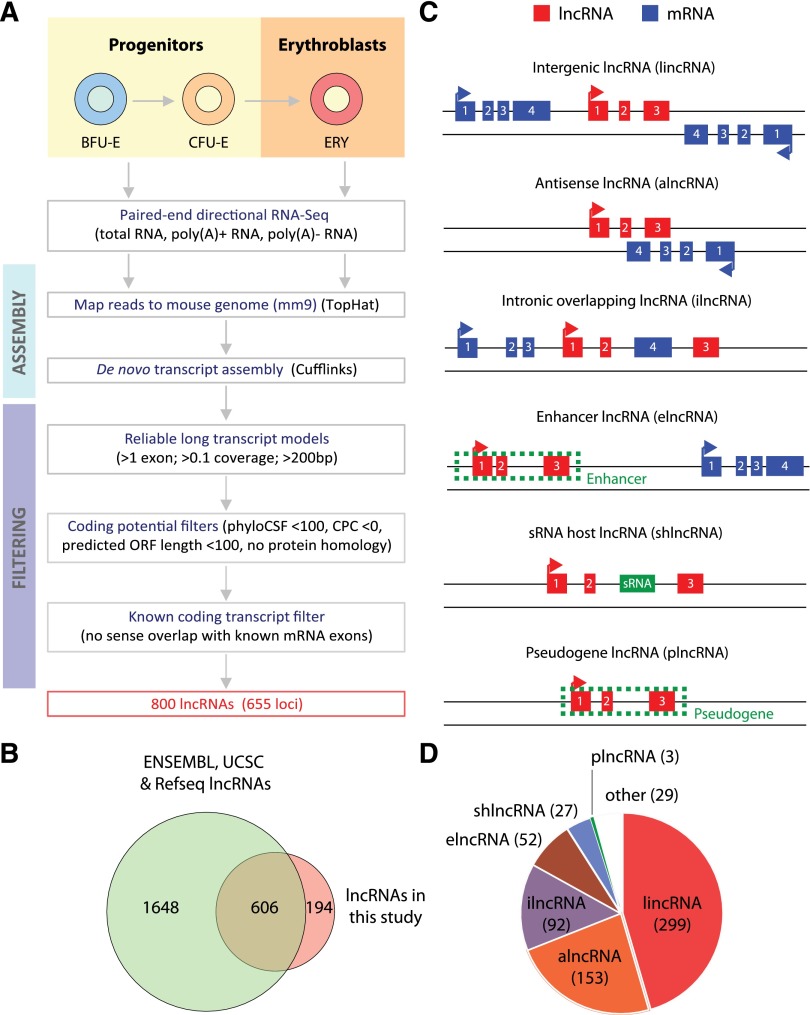
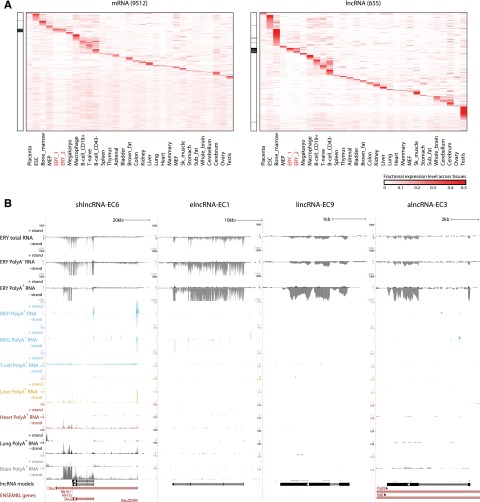
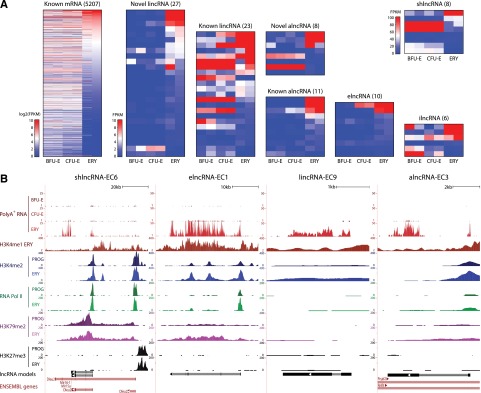
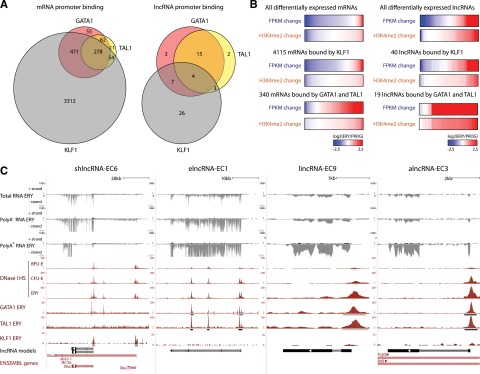
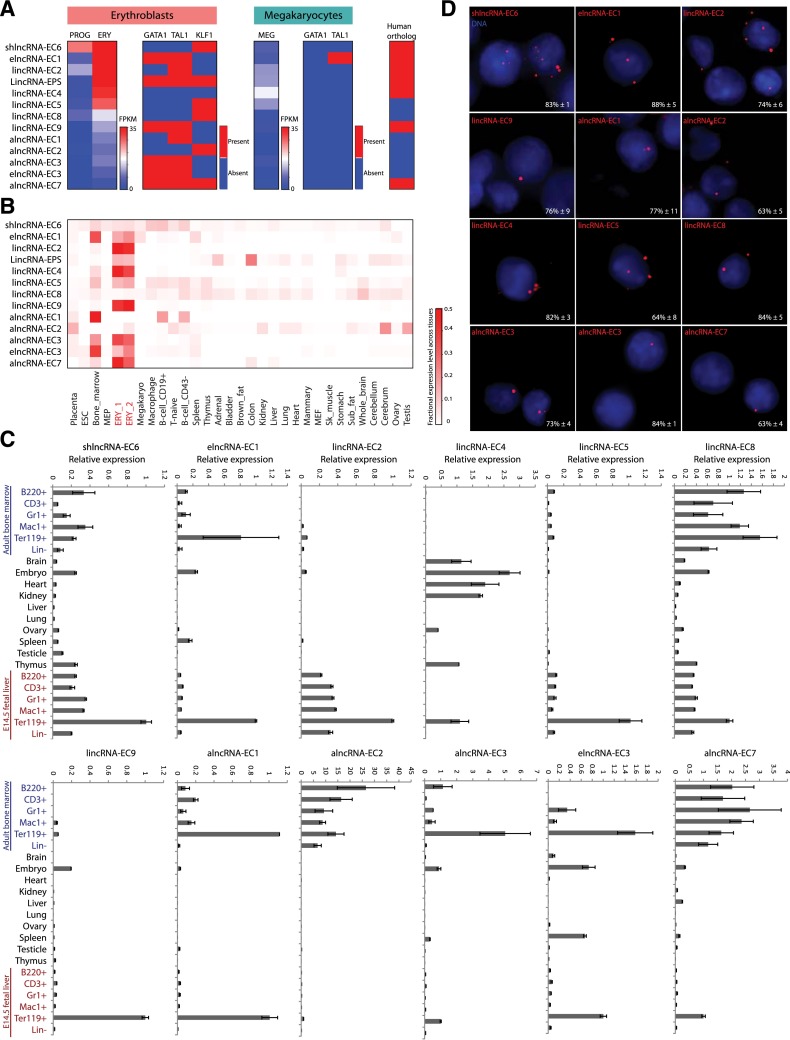
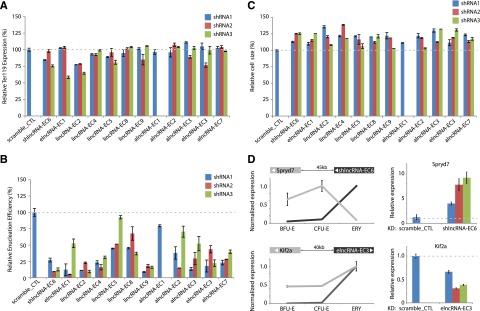
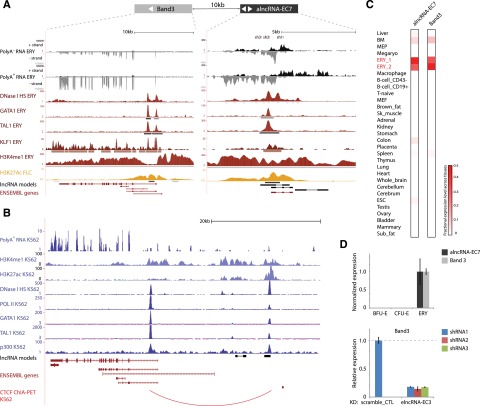
Erythropoiesis is regulated at multiple levels to ensure the proper generation of mature red cells under multiple physiological conditions. To probe the contribution of long noncoding RNAs (lncRNAs) to this process, we examined >1 billion RNA-seq reads of polyadenylated and nonpolyadenylated RNA from differentiating mouse fetal liver red blood cells and identified 655 lncRNA genes including not only intergenic, antisense, and intronic but also pseudogene and enhancer loci. More than 100 of these genes are previously unrecognized and highly erythroid specific. By integrating genome-wide surveys of chromatin states, transcription factor occupancy, and tissue expression patterns, we identify multiple lncRNAs that are dynamically expressed during erythropoiesis, show epigenetic regulation, and are targeted by key erythroid transcription factors GATA1, TAL1, or KLF1. We focus on 12 such candidates and find that they are nuclear-localized and exhibit complex developmental expression patterns. Depleting them severely impaired erythrocyte maturation, inhibiting cell size reduction and subsequent enucleation. One of them, alncRNA-EC7, is transcribed from an enhancer and is specifically needed for activation of the neighboring gene encoding BAND 3. Our study provides an annotated catalog of erythroid lncRNAs, readily available through an online resource, and shows that diverse types of lncRNAs participate in the regulatory circuitry underlying erythropoiesis.


Figures

Figure 1
Figure 1
Identification of lncRNAs expressed in fetal liver and erythroid cells. (A) Workflow for lncRNA discovery. See text and supplemental “Methods” for details. (B) Overlap between lncRNAs annotated in Ensembl, UCSC, or RefSeq databases and lncRNAs identified in this study. (C) Definitions of different classes of lncRNAs based on their genomic region of origin. (D) Distribution of 655 lncRNAs expressed in fetal liver into different lncRNA classes.
Figure 2
Figure 2
Tissue specificity of fetal liver and erythroid lncRNAs. (A) Relative abundance of mRNA and lncRNA genes (rows) expressed in fetal liver across 30 primary cell and tissue types from the mouse ENCODE consortium (columns). Color intensity represents the fractional gene-level expression across all tissues examined. ERY_1 and ERY_2 (red) are fetal liver TER119+ erythroblast replicates. Tissue expression was quantified based on gene models from our de novo assembly using Cufflinks. Black bars in the left panels highlight empirically defined erythroid-restricted genes. (B) Examples of erythroid-enriched lncRNA loci. These loci were selected based on their expression, regulation, and tissue specificity features (see text). Images from the UCSC Genome Browser depict RNA-seq signal as the density of mapped strand-specific RNA-seq reads. The plus strand (transcribed left to right) and minus strand (transcribed right to left) are denoted to the left of the tracks. Tracks 1 to 6 show in black the RNA-seq signal of total, poly(A), or poly(A)+ RNA from fetal liver TER119+ erythroblasts (ERY). Tracks 7 to 12 depict in light blue the RNA-seq signal of poly(A)+ RNA from other hematopoietic cells: adult megakaryocyte-erythroid progenitors (MEP), fetal megakaryocytes (MEG), and adult T-naïve cells (T-cell), all from the ENCODE consortium. Tracks 13 to 20 show the RNA-seq signal of poly(A)+ RNA from other tissues from the ENCODE consortium: adult liver (yellow), adult heart (red), adult lung (black), and E14.5 whole brain (gray). The bottom tracks depict lncRNA transcript models inferred by de novo assembly using Cufflinks (black) and Ensembl gene annotations (red). Left-to-right arrows indicate transcripts in the plus strand; right-to-left arrows indicate transcripts in the minus strand. Note that all lncRNA transcripts shown are transcribed in the minus strand.
Figure 3
Figure 3
Dynamic expression patterns of lncRNAs during erythroid differentiation. (A) Abundance of mRNAs and lncRNAs that are differentially expressed during erythropoiesis, as determined by DESeq at a 5% false discovery threshold. Shown are absolute gene expression estimates (FPKM) from poly(A)+ RNA-seq of FACS-purified BFU-Es, CFU-Es, and TER119+ erythroblasts (ERY) (2 replicates each), based on gene models from our de novo assembly using Cufflinks. (B) Examples of differentially expressed lncRNA loci, the same RNAs as in Figure 2B. Images from the UCSC Genome Browser depict RNA-seq signal as the density of mapped RNA-seq reads and chromatin immunoprecipitation sequencing (ChIP-seq) signal as the density of processed signal enrichment. Tracks 1 to 3 show in red the non–strand-specific RNA-seq signal of poly(A)+ RNA from FACS-purified fetal liver BFU-Es, CFU-Es, and TER119+ erythroblasts (ERY). Tracks 4 to 12 depict the ChIP-seq signal for H3K4me1, a chromatin mark enriched in promoter and enhancer regions, in ERY (dark red); H3K4me2, associated with transcriptional activation, in erythroid progenitor-enriched fetal liver cells (PROG) and ERY (dark and light blue); serine 5 phosphorylated RNA Pol II, enriched at the TSS of active genes, in PROG and ERY (dark and light green); H3K79me2, associated with transcriptional elongation, in PROG and ERY (dark and light purple); and H3K27me3, associated with transcriptional repression, in PROG and ERY (black). The bottom tracks depict lncRNA transcript models and Ensembl gene annotations as in Figure 2B.
Figure 4
Figure 4
lncRNAs are targeted by core erythroid transcription factors. (A) Binding of GATA1, TAL1, and KLF1 transcription factors within promoter-proximal regions (TSS ± 1 kb) of (left) mRNAs and (right) lncRNAs that are differentially expressed during erythropoiesis (see text). (B) Changes in expression and promoter-proximal (TSS ± 1 kb) H3K4me2 levels for all differentially expressed mRNA or lncRNA genes, for the subset of genes bound by KLF1 or for those bound by both GATA and TAL1. Changes are shown as the log2 ratio of the levels in TER119+ erythroblasts (ERY) to the levels in erythroid progenitor-enriched fetal liver cells (PROG). (C) Examples of differentially expressed lncRNA loci that are bound proximally by GATA1, TAL1, or KLF1, the same RNAs as in Figures 2B and 3B. Images from the UCSC Genome Browser depict the RNA-seq signal as the density of mapped RNA-seq reads, DNase I hypersensitivity (HS) signal as the density of mapped sequencing tags, and ChIP-seq signal as the density of processed signal enrichment. Tracks 1 to 6 show in black the strand-specific RNA-seq signal in the plus strand or minus strand (denoted to the left of the tracks) of total, poly(A), or poly(A)+ RNA from fetal liver TER119+ erythroblasts (ERY). Tracks 7 to 9 depict in red the signal for DNase I HS, associated with open chromatin, in BFU-Es, CFU-Es, and ERY. Tracks 10 to 12 show in red the ChIP-seq signal for GATA1, TAL1, and KLF1, respectively, in ERY. Peaks of signal enrichment are shown in gray under the DNase I HS tracks (determined by I-max, empirical FDR <1%) and under the GATA1, TAL1, and KLF1 tracks (determined by MACS, empirical FDR <5%). The bottom tracks depict lncRNA transcript models and Ensembl gene annotations as in Figure 2B.
Figure 5
Figure 5
Selection and validation of lncRNA targets. (A) Summary of expression, regulation, and conservation features of the top candidate lncRNA modulators of erythropoiesis (see text). Expression: shown are absolute gene expression estimates (FPKM) from RNA-seq of total RNA from erythroid progenitor-enriched fetal liver cells (PROG) and TER119+ erythroblasts (ERY) or of poly(A)+ RNA from primary megakaryocytes (MEG), quantified as in Figure 3. Regulation: heatmaps represent whether promoter-proximal binding by GATA1, TAL1, of KLF1, analyzed as in Figure 4, is seen in ERY or MEG. Conservation: heatmap represents whether an orthologous region, identified by local alignment and synteny, is found in the human genome (see supplemental Methods for details). (B) Relative abundance of the top lncRNA candidates across 30 mouse primary tissue and cell types from ENCODE, determined as in Figure 2. Color intensity represents the fractional expression level across all tissues examined. ERY_1 and ERY_2 (red) are TER119+ fetal liver erythroblast biological replicate experiments. (C) Relative expression of the top lncRNA candidates across mouse organs and cells of different tissues and developmental stages, as determined by qPCR. Expression levels were normalized to those of 18S rRNA, and fold changes were calculated relative to fetal TER119+ erythroblast levels. Data are shown as mean ± standard error of the mean (SEM; n = 3). (D) Detection of individual lncRNA transcripts by single-molecule RNA FISH. Shown are maximum z-stack projections of fluoresce microscopy images of fixed TER119+ erythroblasts hybridized to singly-labeled RNA FISH probes. lncRNA molecules are pseudocolored red and DAPI-stained nuclei are pseudocolored blue. For each panel, the mean ± SEM (n = 2) percent of nuclear-localized transcripts is shown at the bottom right corner.
Figure 6
Figure 6
Modulation of red cell maturation by multiple types of lncRNAs. (A) Relative expression of the early erythroid differentiation marker TER119 in erythroid progenitor-enriched fetal liver cells transduced with retroviral vectors encoding control or lncRNA-targeting shRNAs and induced to differentiate in culture. Expression levels were determined by qPCR, normalized to those of 18S rRNA, and are shown as percentage of the levels in the control shRNA experiment (dotted gray line). Data are mean ± SEM (n = 2). (B) Relative cell size of cells treated as in A. Average cell sizes were determined by flow cytometry (Methods) and are shown as percentage of the values for the control shRNA experiment (dotted gray line). Data are mean ± SEM (n = 2). (C) Relative enucleation efficiency of cells treated as in A. Enucleation efficiency was determined by flow cytometry (Methods) and is shown as percentage of the values for the control shRNA experiment (dotted gray line). Data are shown as mean ± SEM (n = 2). (D) (Top left) SPRYD7 (light gray) is anticorrelated in expression with its neighbor shlncRNA-EC6 (dark gray) during erythropoiesis. (Top right) depletion of shlncRNA-EC6 with separate shRNAs in ex vivo–differentiated TER119+ erythroblasts results in reproducible up-regulation of SPRYD7 relative to scramble shRNA control (data are mean ± SEM; n = 3). (Bottom left) KIF2A (light gray) is coordinated in expression with neighboring elncRNA-EC3 (dark gray) during erythroid differentiation. (Bottom right) inhibiting elncRNA-EC3 with separate shRNAs leads to reduced expression of KIF2A relative to scramble shRNA control (data are mean ± SEM; n = 3).
Figure 7
Figure 7
alncRNA-EC7 is an enhancer RNA needed for expression of neighboring BAND 3. (A) alncRNA-EC7 marks an enhancer site proximal to BAND 3. Images from the UCSC Genome Browser depict RNA-seq signal as the density of mapped RNA-seq reads, DNase I hypersensitivity (HS) signal as the density of mapped sequencing tags, and ChIP-seq signal as the density of processed signal enrichment. Tracks 1 to 4 show in black the strand-specific RNA-seq signal in the plus strand or minus strand (denoted to the left of the tracks) of poly(A) or poly(A)+ RNA from fetal liver TER119+ erythroblasts (ERY). Track 5 depicts in red the signal for DNase I HS, associated with open chromatin, in ERY. Tracks 6 to 8 show in red the ChIP-seq signal for GATA1, TAL1, and KLF1, respectively, in ERY. Tracks 9 and 10 depict the ChIP-seq signal for H3K4me1, enriched along promoter and enhancer regions, in ERY (dark red), and H3K27Ac, associated with active promoters and enhancers, in fetal liver cells (yellow). Peaks of signal enrichment are shown in gray under the DNase I HS track (determined by I-max, empirical FDR <1%) and under the GATA1, TAL1, KLF1, H3K4me1, and H3K27Ac tracks (determined by MACS, empirical FDR <5%). The bottom tracks depict lncRNA transcript models inferred by de novo assembly using Cufflinks (black) and Ensembl gene annotations (red). Shown at the top are the target sites of 3 shRNAs designed against the transcripts from the enhancer site. (B) The alncRNA-EC7 locus is conserved in human. Images from the UCSC Genome Browser depict RNA-seq signal, DNase I HS signal, and ChIP-seq signal in K562 cells as in A. Track 1 shows in blue the non–strand-specific RNA-seq signal of poly(A)+ RNA. Tracks 2 and 3 depict in light blue the ChIP-seq signal for H3K4me1, enriched along promoter and enhancer regions, and H3K27Ac, associated with active promoters and enhancers. Track 4 depicts in dark blue the signal for DNase I HS, associated with open chromatin. Tracks 5 to 8 show in dark blue the ChIP-seq signal for RNA Pol II, GATA1, TAL1, and p300 (enriched at promoter and enhancer sites), respectively. Shown at the bottom are lncRNA transcript models based on our detection of orthologous genomic regions from local alignment and synteny to the mouse genome (black; supplemental Methods) and Ensembl gene annotations (red). The last track depicts in red chromatin interactions associated with binding of the CTCF binding factor, determined by ChIA-PET. (C) Relative abundance of alncRNA-EC7 and Band 3 mRNA across 30 mouse primary tissue and cell types from ENCODE, determined as in Figure 2. Color intensity represents the fractional expression level across all tissues examined. ERY_1 and ERY_2 (red) are TER119+ fetal liver erythroblast biological replicate experiments. (D) (Top) Band 3 expression is coordinated with that of neighboring alncRNA-EC7 during differentiation. (Bottom) Inhibiting alncRNA-EC7 with the shRNAs shown in A abolishes expression of BAND 3 relative to scramble shRNA control (data are mean ± SEM; n = 3).

Comment in

Similar articles

Cited by

References

    1. Hattangadi SM, Wong P, Zhang L, Flygare J, Lodish HF. From stem cell to red cell: regulation of erythropoiesis at multiple levels by multiple proteins, RNAs, and chromatin modifications. Blood. 2011;118(24):6258–6268. - PMC - PubMed
    1. Cantor AB, Orkin SH. Transcriptional regulation of erythropoiesis: an affair involving multiple partners. Oncogene. 2002;21(21):3368–3376. - PubMed
    1. Kerenyi MA, Orkin SH. Networking erythropoiesis. J Exp Med. 2010;207(12):2537–2541. - PMC - PubMed
    1. Bertone P, Stolc V, Royce TE, et al. Global identification of human transcribed sequences with genome tiling arrays. Science. 2004;306(5705):2242–2246. - PubMed
    1. Carninci P, Kasukawa T, Katayama S, et al. FANTOM Consortium; RIKEN Genome Exploration Research Group and Genome Science Group (Genome Network Project Core Group) The transcriptional landscape of the mammalian genome. Science. 2005;309(5740):1559–1563. - PubMed

Publication types

MeSH terms

Substances