. 2014;13(2):220-6.
doi: 10.4161/cc.26985. Epub 2013 Oct 31.

iRFP is a sensitive marker for cell number and tumor growth in high-throughput systems

Affiliations

iRFP is a sensitive marker for cell number and tumor growth in high-throughput systems

Andreas K Hock et al. Cell Cycle. 2014.

Abstract

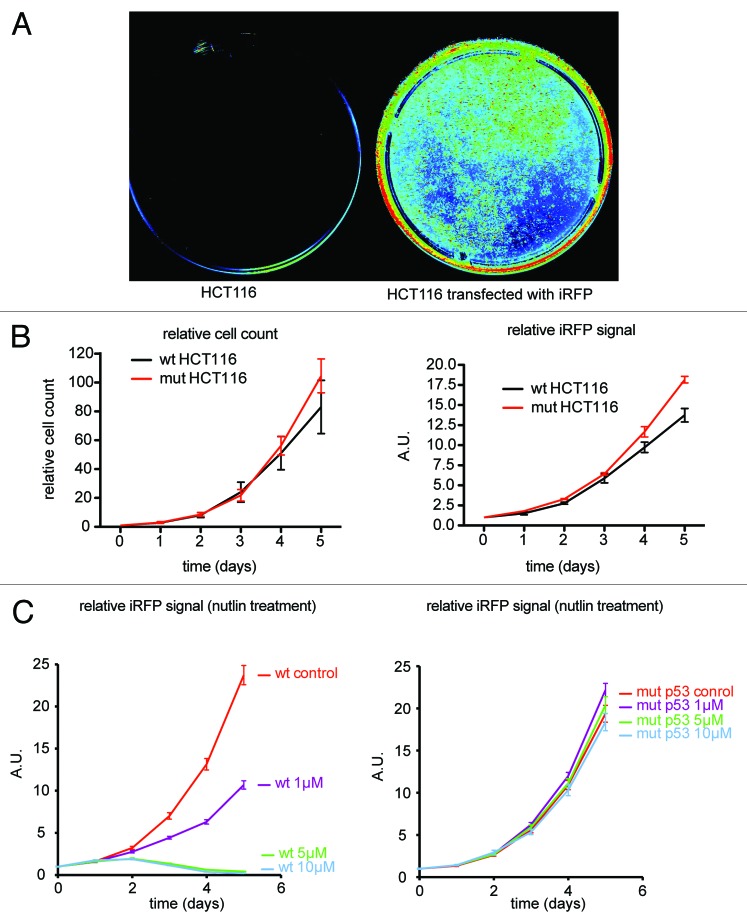
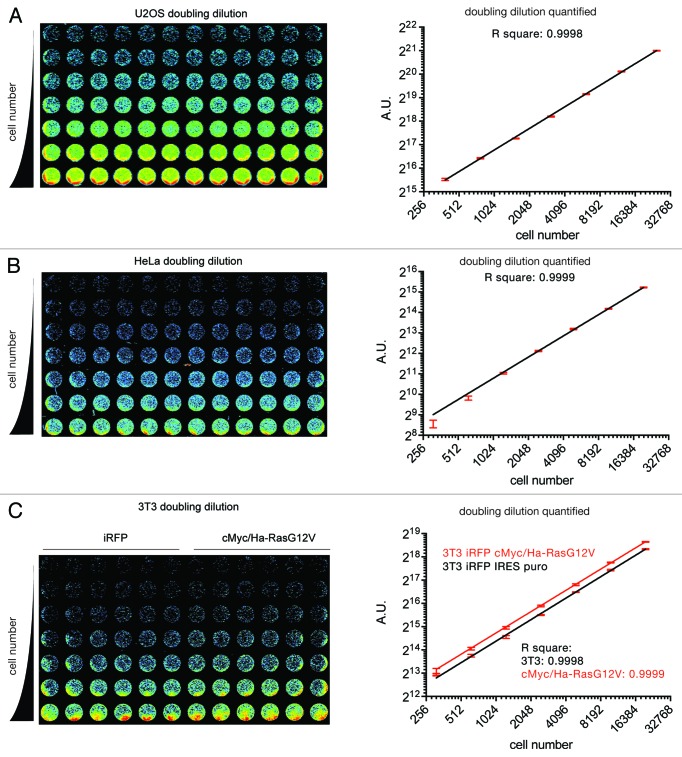
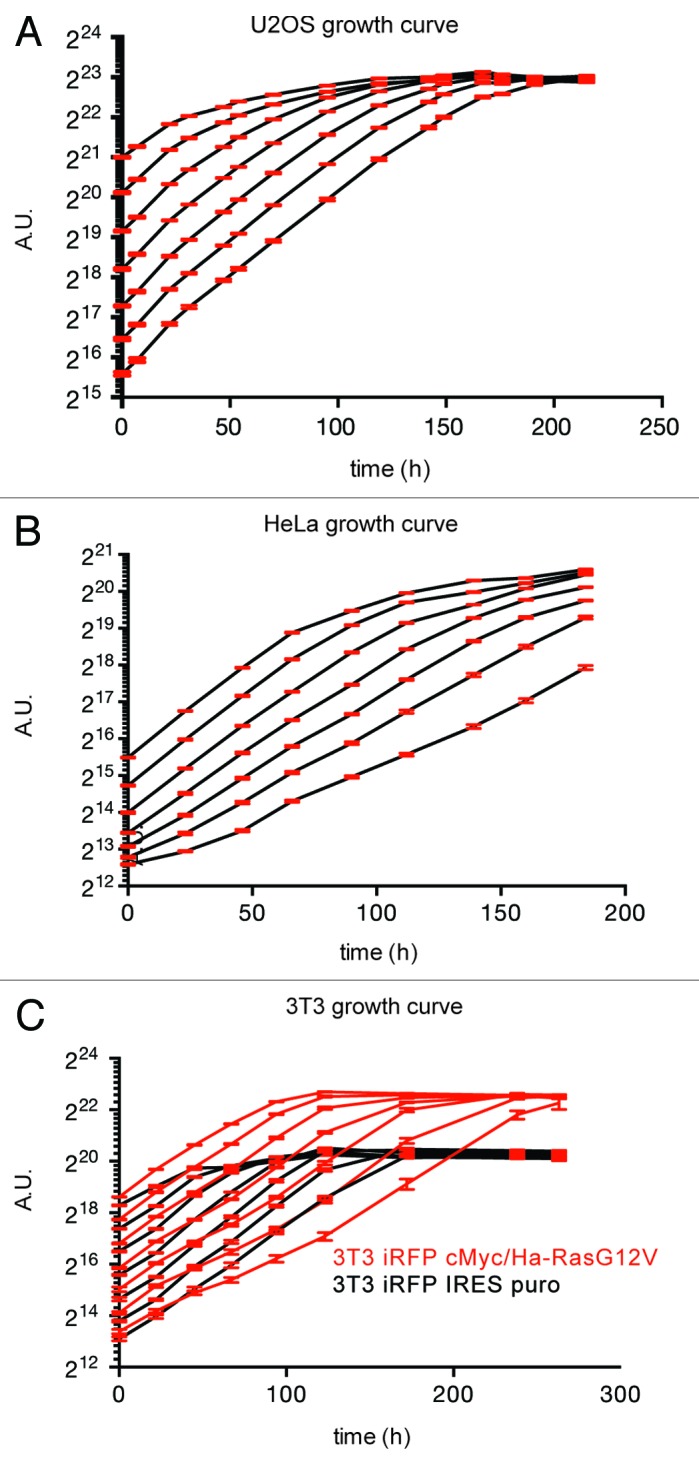
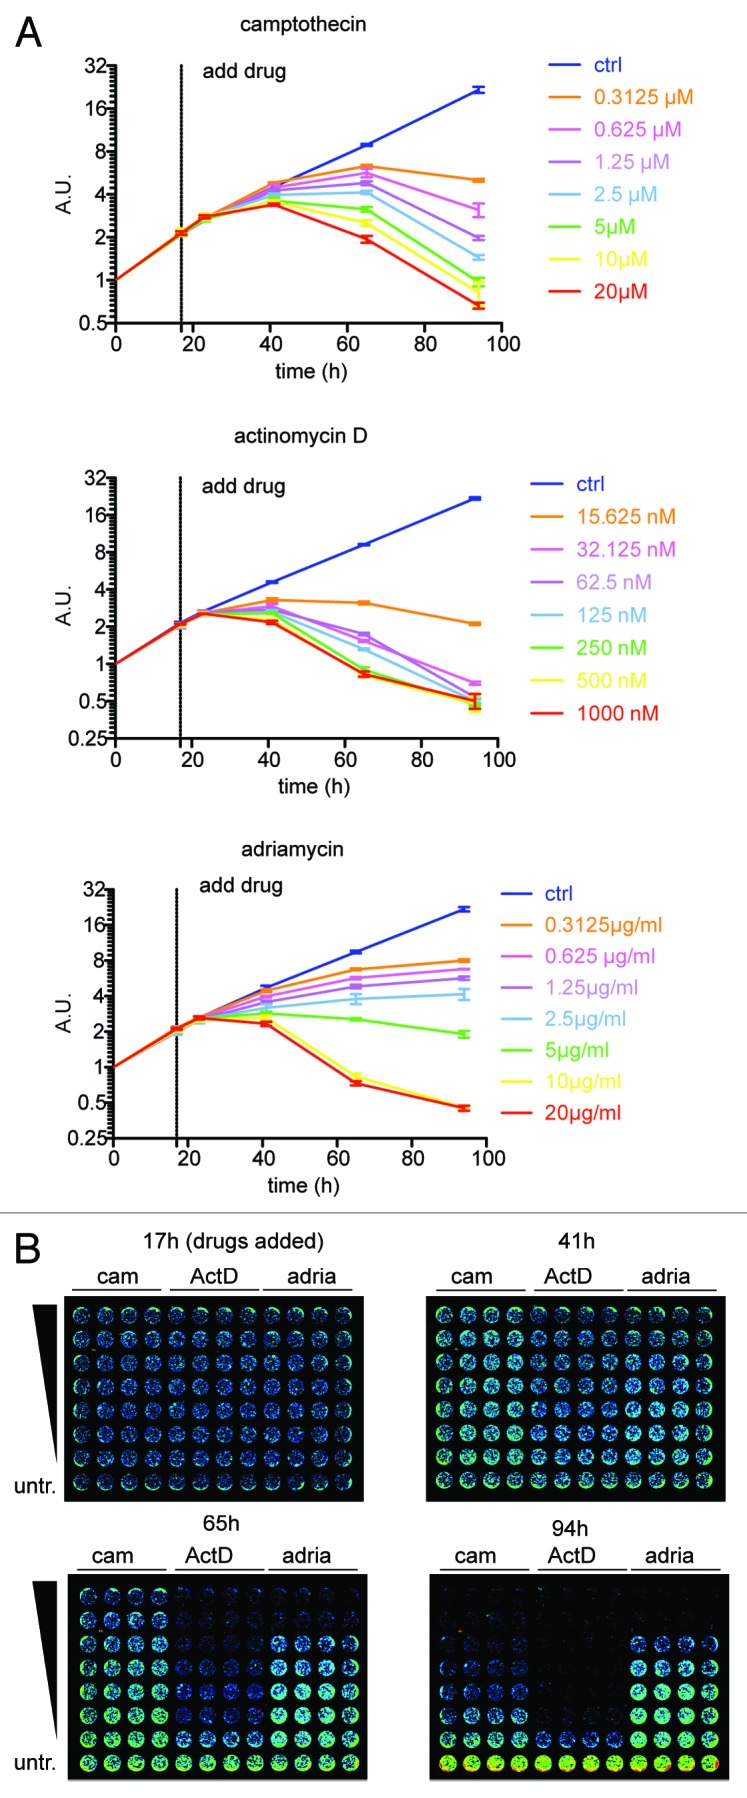
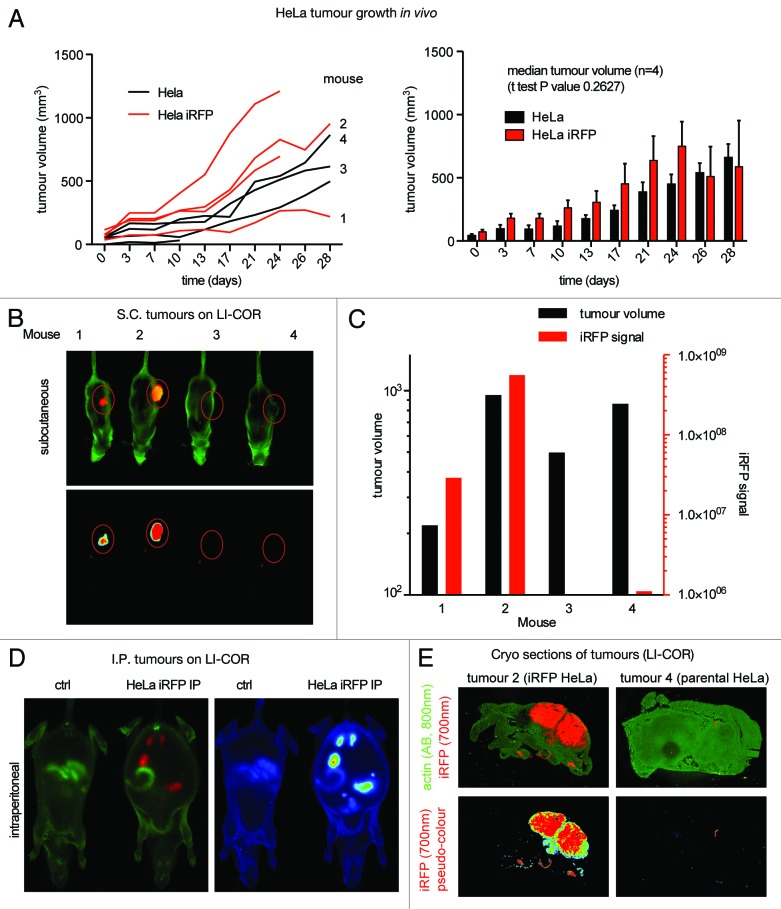
GFP and luciferase are used extensively as markers both in vitro and in vivo although both have limitations. The utility of GFP fluorescence is restricted by high background signal and poor tissue penetrance. Luciferase throughput is limited in vitro by the requirement for cell lysis, while in vivo, luciferase readout is complicated by the need for substrate injection and the dependence on endogenous ATP. Here we show that near-infrared fluorescent protein in combination with widely available near-infrared scanners overcomes these obstacles and allows for the accurate determination of cell number in vitro and tumor growth in vivo in a high-throughput manner and at negligible per-well costs. This system represents a significant advance in tracking cell proliferation in tissue culture as well as in animals, with widespread applications in cell biology.

Keywords: cancer; iRFP cell number quantification; in vivo; near-infrared fluorescence.


Figures

None
Figure 1. iRFP can be detected in the LI-COR to monitor cell growth. (A) LI-COR 700 nm scan of parental HCT116 cells and HCT116 cells transiently transfected with iRFP expression plasmid. (B) HCT116 WT and p53R248W/-mutant cells stably expressing iRFP were plated and counted, or Odyssey quantified at the indicated times. Error bars represent SEM of 3 technical replicates. (C) HCT116 WT and p53R248W/- mutant cells stably expressing iRFP were treated with the indicated doses of Nutlin and quantified using the Odyssey at the indicated times. Error bars represent SEM of 3 parallel processed replicates.
None
Figure 2. iRFP as a marker for cell number in vitro. Doubling dilution of U2OS (A), HeLa (B), and parental or cMyc/Ha-RasG12V-transformed 3T3 cells (C) stably expressing iRFP. Cells were seeded in 96-well plates at the indicated numbers by doubling dilutions. After 8 h, plates were scanned (left) the iRFP signal determined and and plotted against cell number. Error bars indicate SEM of 12 (A and B) or 6 (C) replicate wells.
None
Figure 3. iRFP as a marker for cell proliferation in vitro. (A–C) Plates as described in Figure 2 were scanned at the indicated time points, quantified, and plotted over time. Error bars indicate SEM of 12 replicate wells.
None
Figure 4. iRFP quantification to monitor the effect of drugs on cell growth. (A) HeLa cells described in Figures 2Band3B were plated at 7500 cells per well, quantified after 7 h settling time (t0), and treated after 17 h with the indicated drugs. Error bars indicate SEM of 4 replicate wells. (B) Selected Odyssey 700 nm scans of iRFP expressing HeLa cells treated at the indicated time points with several concentrations of chemotherapeutics.
None
Figure 5. iRFP as a marker for tumor growth in vivo: (A) 3 × 10⁶ HeLa cells were subcutaneously injected into CD1 nude mice. Tumor volumes were determined by caliper measurement at indicated time-points. Comparison of parental with iRFP expressing HeLa tumors did not reveal any significant differences. Error bars represent the SEM of tumor measurements shown on the left (B) 700 nm Odyssey scans of the indicated mice in Figure 5A. (C) Odyssey quantification of Figure 5B. (D) Left: Odyssey scans of mice 21 days after IP injection with 2 × 10⁶ iRFP expressing HeLa cells. An untreated mouse is shown as control. 700-nm scan (red) was used to visualize the tumors, and 800 nm scan (green) to show the outline of the mouse. Right: Pseudo-color representation of the 700 nm channel. (E) Frozen sections of tumor and surrounding tissue of mouse 2 and 4. Tumors were frozen, cut, and fixed with PFA followed by an actin stain. Top panels: Odyssey scan with the iRFP signal in the 700 nm channel (red) and the anti-actin antibody signal in the 800 nm channel (green). Bottom panel: Pseudo-color representations of the iRFP signal detected by Odyssey scan in the 700 nm channel.

References

    1. Chudakov DM, Matz MV, Lukyanov S, Lukyanov KA. Fluorescent proteins and their applications in imaging living cells and tissues. Physiol Rev. 2010;90:1103–63. doi: 10.1152/physrev.00038.2009. - DOI - PubMed
    1. Hong H, Yang Y, Cai W. Imaging gene expression in live cells and tissues. Cold Spring Harb Protoc. 2011;2011:top103. doi: 10.1101/pdb.top103. - DOI - PMC - PubMed
    1. Lyons SK, Patrick PS, Brindle KM. Imaging mouse cancer models in vivo using reporter transgenes. Cold Spring Harb Protoc. 2013;2013:685–99. doi: 10.1101/pdb.top069864. - DOI - PubMed
    1. Filonov GS, Piatkevich KD, Ting LM, Zhang J, Kim K, Verkhusha VV. Bright and stable near-infrared fluorescent protein for in vivo imaging. Nat Biotechnol. 2011;29:757–61. doi: 10.1038/nbt.1918. - DOI - PMC - PubMed
    1. Shcherbakova DM, Verkhusha VV. Near-infrared fluorescent proteins for multicolor in vivo imaging. Nat Methods. 2013;10:751–4. doi: 10.1038/nmeth.2521. - DOI - PMC - PubMed

Publication types

MeSH terms