

Identification of ribonucleotide reductase M2 as a potential target for pro-senescence therapy in epithelial ovarian cancer
- PMID: 24200970
- PMCID: PMC3906237
- DOI: 10.4161/cc.26953
Identification of ribonucleotide reductase M2 as a potential target for pro-senescence therapy in epithelial ovarian cancer
Abstract
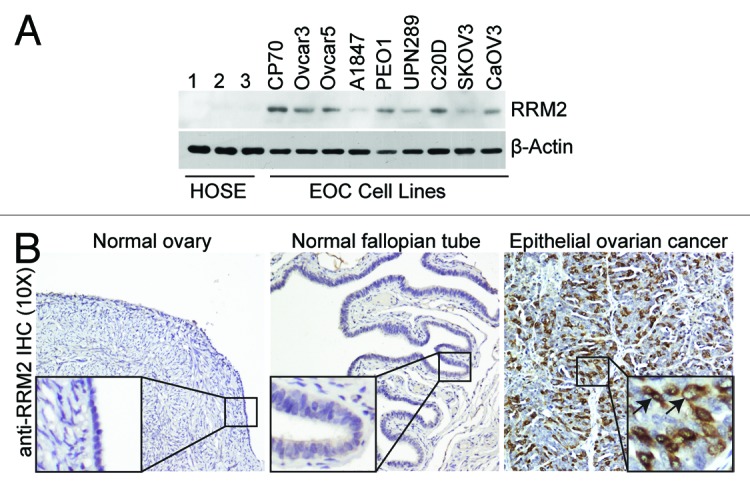
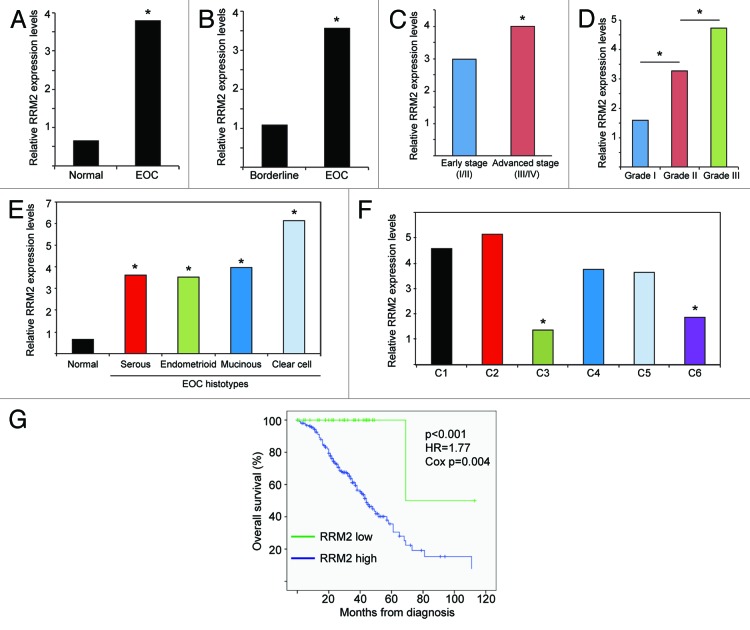
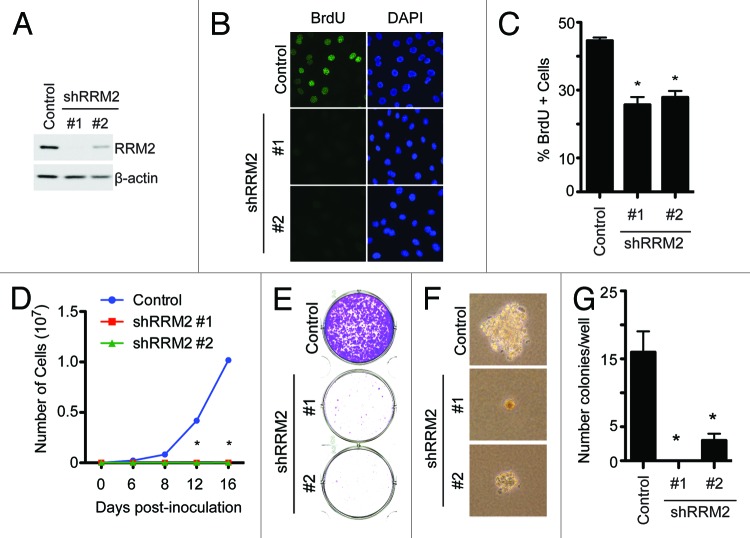
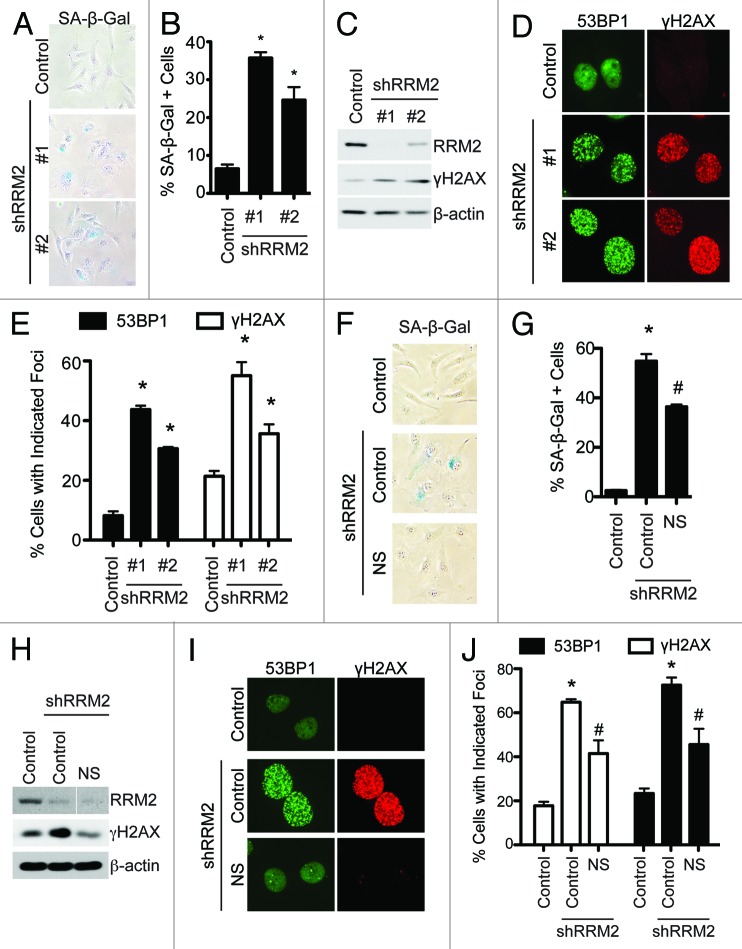
Epithelial ovarian cancer (EOC) is the leading cause of gynecological-related cancer deaths in the United States. There is, therefore, an urgent need to develop novel therapeutic strategies for this devastating disease. Cellular senescence is a state of stable cell growth arrest that acts as an important tumor suppression mechanism. Ribonucleotide reductase M2 (RRM2) plays a key role in regulating the senescence-associated cell growth arrest by controlling biogenesis of 2'-deoxyribonucleoside 5'-triphosphates (dNTPs). The role of RRM2 in EOC remains poorly understood. Here we show that RRM2 is expressed at higher levels in EOCs compared with either normal ovarian surface epithelium (P<0.001) or fallopian tube epithelium (P<0.001). RRM2 expression significantly correlates with the expression of Ki67, a marker of cell proliferation (P<0.001). Moreover, RRM2 expression positively correlates with tumor grade and stage, and high RRM2 expression independently predicts a shorter overall survival in EOC patients (P<0.001). To delineate the functional role of RRM2 in EOC, we knocked down RRM2 expression in a panel of EOC cell lines. Knockdown of RRM2 expression inhibits the growth of human EOC cells. Mechanistically, RRM2 knockdown triggers cellular senescence in these cells. Notably, this correlates with the induction of the DNA damage response, a known mediator of cellular senescence. These data suggest that targeting RRM2 in EOCs by suppressing its activity is a novel pro-senescence therapeutic strategy that has the potential to improve survival of EOC patients.
Keywords: DNA damage response; cell proliferation; cellular senescence; epithelial ovarian cancer; ribonucleotide reductase M2 (RRM2).
Figures
Similar articles
-
Wnt5a suppresses epithelial ovarian cancer by promoting cellular senescence.Cancer Res. 2011 Oct 1;71(19):6184-94. doi: 10.1158/0008-5472.CAN-11-1341. Epub 2011 Aug 4. Cancer Res. 2011. PMID: 21816908 Free PMC article.
-
FOXM1 expression is significantly associated with chemotherapy resistance and adverse prognosis in non-serous epithelial ovarian cancer patients.J Exp Clin Cancer Res. 2017 May 8;36(1):63. doi: 10.1186/s13046-017-0536-y. J Exp Clin Cancer Res. 2017. PMID: 28482906 Free PMC article.
-
SUZ12 promotes human epithelial ovarian cancer by suppressing apoptosis via silencing HRK.Mol Cancer Res. 2012 Nov;10(11):1462-72. doi: 10.1158/1541-7786.MCR-12-0335. Epub 2012 Sep 10. Mol Cancer Res. 2012. PMID: 22964433 Free PMC article.
-
Cancerous ovarian stem cells: obscure targets for therapy but relevant to chemoresistance.J Cell Biochem. 2013 Jan;114(1):21-34. doi: 10.1002/jcb.24317. J Cell Biochem. 2013. PMID: 22887554 Review.
-
The Transcoelomic Ecosystem and Epithelial Ovarian Cancer Dissemination.Front Endocrinol (Lausanne). 2022 Apr 28;13:886533. doi: 10.3389/fendo.2022.886533. eCollection 2022. Front Endocrinol (Lausanne). 2022. PMID: 35574025 Free PMC article. Review.
Cited by
-
ATM inhibition synergizes with fenofibrate in high grade serous ovarian cancer cells.Heliyon. 2020 Sep 29;6(9):e05097. doi: 10.1016/j.heliyon.2020.e05097. eCollection 2020 Sep. Heliyon. 2020. PMID: 33024871 Free PMC article.
-
The Clinical and Prognostic Significance of Ribonucleotide Reductase Subunits RRM1 and RRM2 mRNA Levels in Patients with Chronic Lymphocytic Leukemia.Clin Hematol Int. 2023 Jun;5(2-3):92-100. doi: 10.1007/s44228-023-00033-x. Epub 2023 Feb 22. Clin Hematol Int. 2023. PMID: 36811764 Free PMC article.
-
Ribonucleotide reductase small subunit M2 is a master driver of aggressive prostate cancer.Mol Oncol. 2020 Aug;14(8):1881-1897. doi: 10.1002/1878-0261.12706. Epub 2020 May 31. Mol Oncol. 2020. PMID: 32385899 Free PMC article.
-
Gene expression signature based screening identifies ribonucleotide reductase as a candidate therapeutic target in Ewing sarcoma.Oncotarget. 2016 Sep 27;7(39):63003-63019. doi: 10.18632/oncotarget.11416. Oncotarget. 2016. PMID: 27557498 Free PMC article.
-
Nucleotide metabolism, oncogene-induced senescence and cancer.Cancer Lett. 2015 Jan 28;356(2 Pt A):204-10. doi: 10.1016/j.canlet.2014.01.017. Epub 2014 Jan 29. Cancer Lett. 2015. PMID: 24486217 Free PMC article. Review.
References
-
- Arulkumaran S, Regan L, Farquharson DIM. Obstetrics and gynaecology. Oxford: Oxford University Press, 2011.
Publication types
MeSH terms
Substances
Grants and funding
LinkOut - more resources
Full Text Sources
Other Literature Sources
Medical
Miscellaneous