. 2013 Nov 7;503(7474):121-5.
doi: 10.1038/nature12743.

The activity-dependent transcription factor NPAS4 regulates domain-specific inhibition

Affiliations

The activity-dependent transcription factor NPAS4 regulates domain-specific inhibition

Brenda L Bloodgood et al. Nature. .

Abstract

A heterogeneous population of inhibitory neurons controls the flow of information through a neural circuit. Inhibitory synapses that form on pyramidal neuron dendrites modulate the summation of excitatory synaptic potentials and prevent the generation of dendritic calcium spikes. Precisely timed somatic inhibition limits both the number of action potentials and the time window during which firing can occur. The activity-dependent transcription factor NPAS4 regulates inhibitory synapse number and function in cell culture, but how this transcription factor affects the inhibitory inputs that form on distinct domains of a neuron in vivo was unclear. Here we show that in the mouse hippocampus behaviourally driven expression of NPAS4 coordinates the redistribution of inhibitory synapses made onto a CA1 pyramidal neuron, simultaneously increasing inhibitory synapse number on the cell body while decreasing the number of inhibitory synapses on the apical dendrites. This rearrangement of inhibition is mediated in part by the NPAS4 target gene brain derived neurotrophic factor (Bdnf), which specifically regulates somatic, and not dendritic, inhibition. These findings indicate that sensory stimuli, by inducing NPAS4 and its target genes, differentially control spatial features of neuronal inhibition in a way that restricts the output of the neuron while creating a dendritic environment that is permissive for plasticity.


Figures

Extended Data Figure 1
Infection with AAV-Cre-GFP effectively excises Npas4. a, Schematic of the AAV-Cre–GFP virus genome. b, Representative hippocampal section from an AAV-Cre–GFP; Npas4f/f animal 3 h after kainic acid injection. Sections were imaged for native GFP fluorescence (green) and immunostained NPAS4 (red) and NeuN (blue) protein. c, Quantification of neurons with overlapping GFP and NPAS4 in the sections represented in b. n = 14 neurons, *P < 0.01.
Extended Data Figure 2
NPAS4-dependent changes in inhibition require loss of NPAS4 in excitatory neurons. a, mIPSCs frequency (left) and amplitude (right) were measured from pairs of neighbouring GFP+ and GFP neurons from wild-type (C57BL/6) mice maintained in standard housing. n = 17 pairs. b, mIPSCs frequency (left) and amplitude (right) were measured from pairs of neighbouring GFP+ and GFP neurons from wild-type (C57BL/6) mice 24 h after injection of kainic acid. n = 17 pairs. Open circles indicate individual GFP+/GFP pairs. Red circles indicate mean ± s.e.m. c, Representative hippocampal CA1 section from an EMX-Cre;Npas4f/+ and EMX-Cre;Npas4f/f mouse 3 h after kainic acid injection. Sections were immunostained for NPAS4 (red) protein. d, Quantification of NPAS4 immunoreactivity. n = 9 sections from 3 animals. *P < 0.05. e, mIPSCs frequency and amplitude measured from neurons in EMX-Cre;Npas4f/f mice maintained in standard housing (n = 14 neurons) or 24 h after kainic acid injection (n = 16 neurons). freq: P < 0.01; amp: P < 0.05.
Extended Data Figure 3
Stimulation of axons in different hippocampal layers generates eIPSCs with distinct rise times. a, Cartoon of a CA1 pyramidal neuron and example eIPSCs generated in response to stimulation of axons in lacunosum (L, blue), radiatum (R, yellow), pyramidale (P, red) and oriens (O, green). Slopes (10–90% of the peak eIPSC) are indicated by coloured lines. b, Standard housing summary of the slopes of the eIPSC rise times recorded from neighbouring NPAS4-WT and NPAS4-KO neurons in response to stimulation of axons in each of the four hippocampal layers. Measurements are from eIPSCs in Fig. 2b–e. c, Enriched environment summary of the slopes as in b. Measurements are from eIPSCs in Fig. 2f–i. d, Kainic acid summary of the slopes as in (b). Measurements are from eIPSCs in Extended Data Fig. 4b–e.
Extended Data Figure 4
NPAS4 differentially regulates inhibitory synapses across the somato-dendritic axis of pyramidal neurons in response to kainic acid. a, Experimental configuration. L, lacunosum; R, radiatum; P, pyramidale; O, oriens. b–e, eIPSCs measured from mice injected with kainic acid. Top shows average eIPSC, normalized pairwise to the wild-type neuron, measured from NPAS4-WT (black) and NPAS4-KO (green) neurons in response to stimulation in lacunosum (b), radiatum (c), pyramidale (d) or oriens (e). Scale bars indicate per cent change from wild type. Bottom shows eIPSC amplitude measured from pairs of neighbouring NPAS4-KO and NPAS4-WT neurons in response to stimulation of axons in lacunosum (b) (n = 13 pairs); radiatum (c) (n = 17 pairs, P < 0.05); pyramidale (d) (n = 18 pairs, P < 0.01); or oriens (e) (n = 15 pairs, P < 0.05). Open circles represent NPAS4-KO/NPAS4-WT pairs. Red circles indicate mean ± s.e.m.
Extended Data Figure 5
Sholl analysis and paired pulse ratios for NPAS4-WT and NPAS4-KO neurons from mice injected with kainic acid. a, Schematic of the AAV-YFP-2A-Cre virus genome used for Sholl analysis. b, Kainic acid example NPAS4-WT and NPAS4-KO CA1 pyramidal neurons (left) and quantification of NPAS4-WT (black, n = 10 neurons) and NPAS4-KO (red, n = 13 neurons) dendrites (right). c–e, PPRs measured from NPAS4-WT and NPAS4-KO neurons in response to stimulation in radiatum (c), pyramidale (d) or oriens (e). Standard housing (black) or kainic acid (red). Standard housing data are re-plotted from Fig. 3c–e. R, n = 11 neurons; P, n = 13 neurons; O, n = 8 neurons. All data are shown as mean ± s.e.m.
Extended Data Figure 6
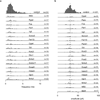
Functional screen of putative NPAS4 target genes identifies many genes that regulate mIPSCs frequency or amplitude. a, b, mIPSCs were recorded from CA1 pyramidal neurons transfected with a pool of three shRNAs targeting a single putative NPAS4 target gene. mIPSC frequency (a) and amplitude (b) of those significantly different from control are shown. Knockdown of genes that result in fewer or smaller mIPSCs are shown on top (mustard); knockdown of genes that result in more or larger mIPSCs are shown on the bottom (blue). The dashed line represents the median value from control conditions. P < 0.05.
Extended Data Figure 8
Many putative NPAS4 target genes do not regulate inhibitory synapses. a, b, mIPSCs were recorded from CA1 pyramidal neurons transfected with a pool of three shRNAs targeting a single putative NPAS4 target gene. mIPSC frequency (a) and amplitude (b) of those not significantly different from control are shown.
Extended Data Figure 9
BDNF regulates somatic inhibitory synapses in response to kainic acid. a–c, eIPSCs were measured simultaneously from neighbouring BDNF-WT (black) and BDNF-KO (green) neurons from mice injected with kainic acid. Top shows average eIPSC, normalized pairwise to the wild-type neuron, measured from BDNF-WT (black) and BDNF-KO (green) neurons in response to stimulation of axons in radiatum (a), pyramidale (b) or oriens (c). Scale bars indicate per cent change from wild type. Bottom shows eIPSC amplitude measured from pairs of neighbouring BDNF-KO and BDNF-WT neurons in response to stimulation of axons in radiatum (a) (n = 14 pairs), pyramidale (b) (n = 12 pairs, P < 0.01), or oriens (c) (n = 15 pairs). Open circles represent BDNF-KO/BDNF-WT pairs. Red circles indicate mean ± s.e.m.
Figure 1
Figure 1
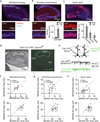
Exposure of mice to increased circuit activity reveals an NPAS4-dependent regulation of inhibition in vivo. a–c, Hippocampal sections from wild-type mice in standard housing (a), enriched environment (EE) (b) or after kainic acid (KA) injection (c). Sections were immunostained for NPAS4 (red) and NeuN (blue) protein. Quantification is shown in b and c. Data are shown as mean ± s.e.m. For each condition n=3 animals with 3–5 sections per animal. *P<0.01. d, Wide-field (left) and fluorescence (right) image of hippocampal slice from an Npas4f/f mouse injected with AAVCre–GFP. e, Experimental configuration. f–h, mIPSC frequency (top) and amplitude (bottom) recorded from neighbouring NPAS4-WT and NPAS4-KO neurons from mice maintained in standard housing (f) (n=14 pairs), enriched environment (g) (n=23 pairs, freq: P<0.05) or after kainic acid injection (h) (n=26 pairs, freq: P,0.01, amp: P<0.05). Open circles represent NPAS4-KO/NPAS4-WT pairs. Red circles indicate mean ± s.e.m.
Figure 2
Figure 2
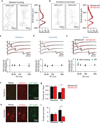
Behaviourally induced NPAS4 differentially regulates inhibitory synapse function across the somato-dendritic axis of pyramidal neurons. a, Experimental configuration. L, lacunosum; R, radiatum; P, pyramidale; O, oriens. b–e, eIPSCs measured from mice maintained in standard housing. Top shows average eIPSC, normalized pairwise to the wild-type neuron, measured from NPAS4-WT (black) and NPAS4-KO (green) neurons in response to stimulation in lacunosum (b), radiatum (c), pyramidale (d) or oriens (e). Scale bars indicate per cent change from wild type. Bottom shows eIPSC amplitude measured from pairs of neighbouring NPAS4-KO and NPAS4-WT neurons in response to stimulation of axons in lacunosum (b) (n=14 pairs), radiatum (c) (n=13 pairs), pyramidale (d) (n=17 pairs) or oriens (e) (n=13 pairs). Open circles represent NPAS4-KO/NPAS4-WT pairs. Red circles indicate mean ± s.e.m. f–i, eIPSCs measured from mice exposed to an enriched environment. Data are displayed as in b–e. L, n=16 pairs; R, n=16 pairs, P<0.05; P, n=14 pairs, P<0.01; O, n=18 pairs.
Figure 3
Figure 3
Behaviourally induced NPAS4 regulates inhibitory synapse number. a, Standard housing example NPAS4-WT and NPAS4-KO CA1 pyramidal neurons (left) and quantification of NPAS4-WT (black, n=10 neurons) and NPAS4-KO (red, n=10 neurons) dendrites (right). b, Enriched environment Sholl analysis, as in a. NPAS4-WT, n=7neurons; NPAS4-KO, n=10 neurons. c–e, PPRs measured from NPAS4-WT and NPAS4-KO neurons in response to stimulation in radiatum (c), pyramidale (d) or oriens (e). Standard housing (black, R, n=9 neurons; P, n=10 neurons; O, n=8 neurons) or enriched environment (green, R, n=16 neurons; P, n=11 neurons; O, n=16 neurons). Examples are from standard housing (top) and are shown normalized to peak current recorded from the NPAS4-WT neuron. Scale bars indicate per cent change from wild type. ISI, interstimulus interval. f, Example image of dendrites in radiatum. g, Quantification of dendritic GFP–gephyrin puncta from NPAS4-WT (black, standard housing, n=15 sections/63 dendritic segments; enriched environment, n=14 sections/40 dendritic segments) and NPAS4-KO (red, standard housing, n=18 sections/172 dendritic segments; enriched environment n=18 sections/167 dendritic segments) neurons. Enriched environment P<0.01. h, Example image of somata in pyramidale. i, Quantification of somatic GFP–gephyrin puncta from NPAS4-WT (black, standard housing, n=14 sections/32 soma; enriched environment, n=11 sections/20 soma) and NPAS4-KO (red, standard housing, n=17sections/94 soma, enriched environment: n=21sections/75 soma) neurons. Enriched environment P<0.05. All data are shown as mean ± s.e.m.
Figure 4
Figure 4
Behaviourally induced BDNF regulates somatic but not dendritic inhibition. a, Schematic of Bdnf gene. Exons 1–9 are indicated. b, qPCR of NPAS4 bound DNA. ChIP samples are from wild-type mice in standard conditions (black) or after kainic acid injection (red). us, upstream region; P1, promoter 1; I3, intron 3; neg 1, control region; P4, promoter 4; neg 2, control region. Enrichment relative to input DNA. N=3. *P<0.05. c, Induction of Bdnf exons in wild-type (black, standard housing, n=5 animals; kainic acid, N=6 animals) or Npas4−/− animals (red, standard housing, n=5 animals; kainic acid, n=6 animals) mice as measured by qRT–PCR with exon specific primers, E1–9.*P<0.05. Data in b and c are shown as mean ± s.e.m. d–f, eIPSCs measured from mice maintained in standard housing. Top shows average eIPSC, normalized pairwise to the wild-type neuron, measured from BDNF-WT (black) and BDNF-KO (green) neurons in response to stimulation in radiatum(d), pyramidale (e) or oriens (f). Scale bars indicate per cent change from wild type. Bottom shows eIPSC amplitude measured from pairs of neighbouring BDNF-KO and BDNF-WT neurons in response to stimulation of axons in radiatum (d) (n=14 pairs), pyramidale (e) (n=15 pairs) or oriens (f) (n=11 pairs). Open circles represent BDNF-KO/BDNF-WT pairs. Red circles indicate mean ± s.e.m. g–i, eIPSC measured from mice housed in an enriched environment. Data are shown as in d–f. R, n=10 pairs; P, n=14 pairs; P<0.05; O, n=14 pairs.

Comment in

References

    1. Somogyi P, Klausberger T. Defined types of cortical interneurone structure space and spike timing in the hippocampus. J. Physiol. (Lond.) 2005;562:9–26. - PMC - PubMed
    1. Danglot L, Triller A, Marty S. The development of hippocampal interneurons inrodents. Hippocampus. 2006;16:1032–1060. - PubMed
    1. Freund TF, Buzsáki G. Interneurons of the hippocampus. Hippocampus. 1996;6:347–470. - PubMed
    1. Turner DA. Feed-forward inhibitory potentials and excitatory interactions in guinea-pig hippocampal pyramidal cells. J. Physiol. (Lond.) 1990;422:333–350. - PMC - PubMed
    1. Liu G. Local structural balance and functional interaction of excitatory and inhibitory synapses in hippocampal dendrites. Nature Neurosci. 2004;7:373–379. - PubMed

Publication types

MeSH terms

Substances