. 2014 Feb;24(2):185-99.
doi: 10.1101/gr.164806.113. Epub 2013 Nov 7.

Genome-wide analysis of HPV integration in human cancers reveals recurrent, focal genomic instability

Affiliations

Genome-wide analysis of HPV integration in human cancers reveals recurrent, focal genomic instability

Keiko Akagi et al. Genome Res. 2014 Feb.

Abstract

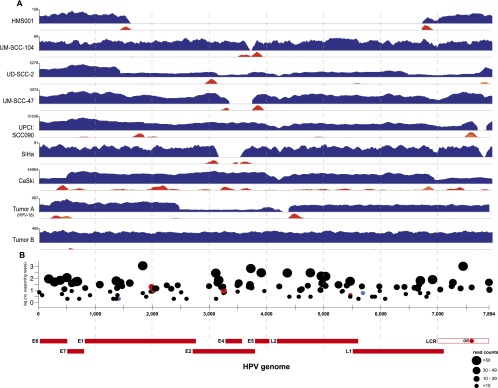
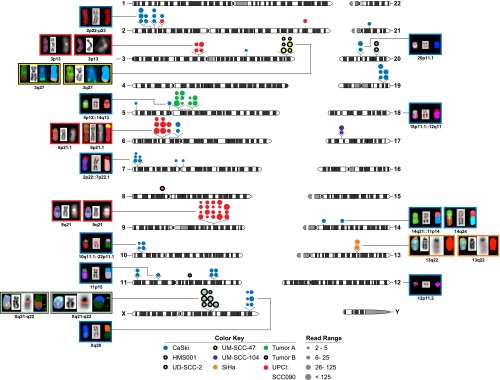
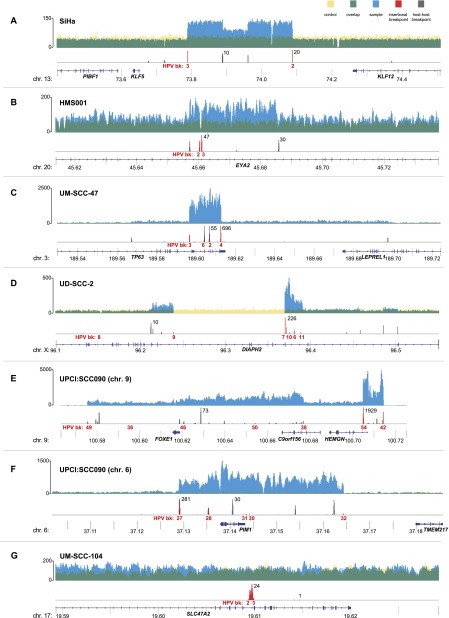
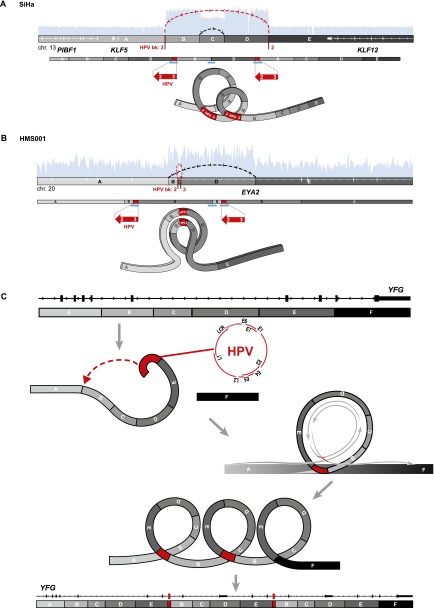
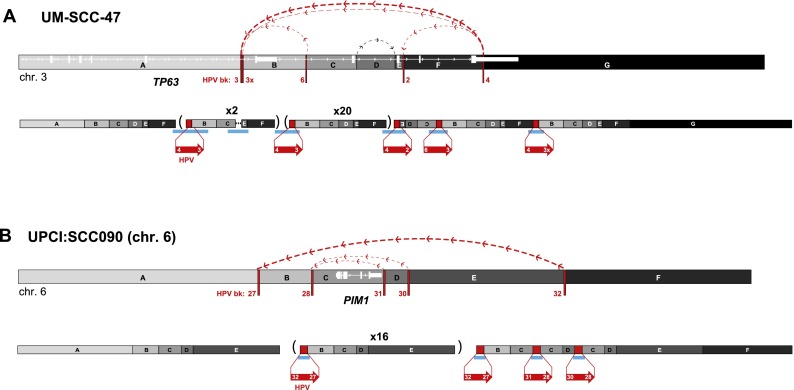
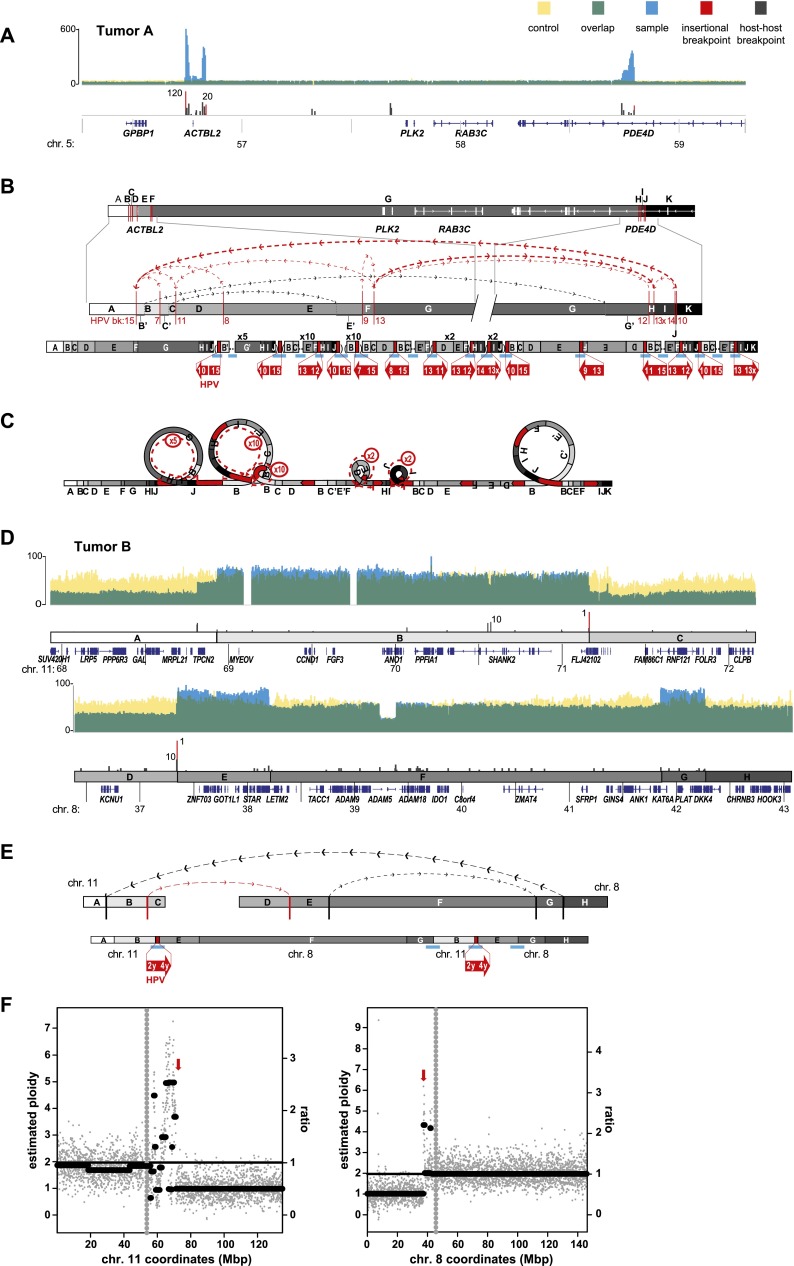
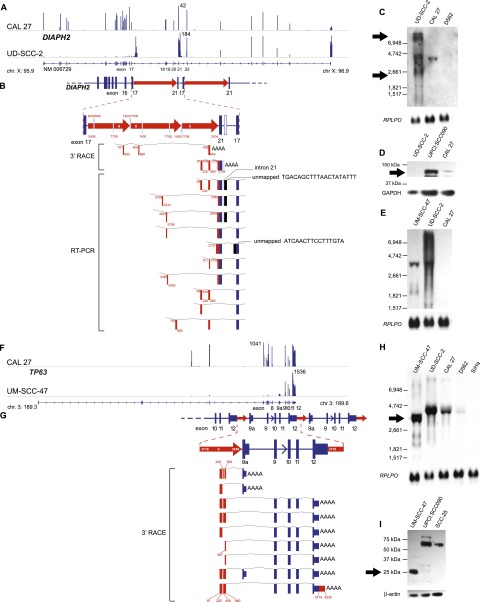
Genomic instability is a hallmark of human cancers, including the 5% caused by human papillomavirus (HPV). Here we report a striking association between HPV integration and adjacent host genomic structural variation in human cancer cell lines and primary tumors. Whole-genome sequencing revealed HPV integrants flanking and bridging extensive host genomic amplifications and rearrangements, including deletions, inversions, and chromosomal translocations. We present a model of "looping" by which HPV integrant-mediated DNA replication and recombination may result in viral-host DNA concatemers, frequently disrupting genes involved in oncogenesis and amplifying HPV oncogenes E6 and E7. Our high-resolution results shed new light on a catastrophic process, distinct from chromothripsis and other mutational processes, by which HPV directly promotes genomic instability.


Figures

Figure 1.
Figure 1.
The HPV virome in human cancers. WGS reads were aligned to the HPV16 (x-axis coordinates, bottom) or HPV18 (Tumor A only) reference genomes. (A) In each row, histograms for various cancer samples indicate copy numbers of viral sequences (blue) and counts of discordant paired-end reads supporting insertional (red), intraviral (yellow), or both (orange) breakpoints. The scale (y-axis) of each plot was normalized to maximum read counts (upper left, each row). HPV breakpoints are defined further in Supplemental Figure 1 and Supplemental Table 3. (B) Verification of insertional breakpoints. Counts of discordant paired-end reads supporting each breakpoint (displayed both on the y-axis and by dot sizes), identified in any of the samples studied, are shown according to position in HPV16 genome (x-axis). (Black dots) Confirmed by PCR and Sanger sequencing; (red) failed PCR; (blue) not tested; (LCR) long control region; (OR) origin of replication. See also Supplemental Figure 2 and Supplemental Tables 3 and 4.
Figure 2.
Figure 2.
HPV integration sites are clustered. HPV insertional breakpoints (dots), identified from discordant paired-end WGS reads, were mapped to human chromosomes (karyotypes, center). FISH and SKY images of chromosomes from various cancer cell lines (background colors, see key) are shown to the left and right of the karyotypes. Each set of FISH/SKY images includes (left) spectral karyotypes, (middle) chromosome banding patterns with HPV insertion sites (pink or teal fluorescent signals), and (right) pseudo-colored cartoons depicting chromosomal composition including translocations. The color key indicates the sample source. See also Supplemental Figures 5 and 6.
Figure 3.
Figure 3.
Focal CNVs and breakpoints adjacent to HPV insertions. Histograms showing the depth of WGS coverage (y-axis) of well-aligned (top; yellow, blue, and green) and breakpoint sequence reads (bottom; red and gray), mapped to the reference human genome (hg19) at indicated chromosomal loci (x-axis, gene schematics, coordinates in megabases). (Top) Focal CNVs and (bottom) HPV insertional (red) or host–host (gray) breakpoints are shown for cancer samples (A) SiHa; (B) HMS001; (C) UM-SCC-47; (D) UD-SCC2; (E) UPCI:SCC090, chromosome 9; (F) UPCI:SCC090, chromosome 6; and (G) UM-SCC-104. (Top, y-axis labels) The depth of WGS coverage is shown for cancer samples (blue); normal control (yellow); overlapping, shared coverage regions (green). (Bottom) Maximal breakpoint read counts (black) and breakpoint ID numbers (HPV bk, red).
Figure 4.
Figure 4.
Focal amplifications and rearrangements explained by “looping” model. Schematics of HPV target sites before (top) and after (middle) viral integration in (A) SiHa and (B) HMS001 cells. We defined genomic segments (marked with capital letters and grayscale fills) based on HPV insertional (red lines) or host–host breakpoints (gray lines). (Top, white rectangles and horizontal lines) Gene exon structures; (arcing dotted lines, arrows: red) connections between HPV insertional breakpoints; (black) host–host breakpoints joining discontinuous reference genome sequences; (light blue histograms) depth of WGS coverage depicting CNVs (see Fig. 3). (Middle: direction of large red arrows) Relative orientation of sense strand of HPV reference genome, not drawn to scale; (white numbers and gaps) viral breakpoint ID numbers and rearrangements; (blue bars) confirmatory PCR amplicons and Sanger sequencing. (Bottom) Inferred, transient looping models to explain formation of CNVs and observed connections between breakpoints. (C) A generalized, stepwise looping model depicting HPV-associated structural variation at YFG (your favorite gene, top) as a target, inferred target nicking and integration of linear HPV genome (red), transient formation of circular DNA containing viral sequences, rolling circle amplification of this template (gray circular arrows), and formation of concatemers harboring identical viral–host and host–host breakpoints. The resulting observed focal amplifications and rearrangements, adjacent to HPV integrants, disrupt expression of YFG (bottom).
Figure 5.
Figure 5.
Connectivity maps of complex, HPV-associated genomic structural variation in HNSCC cell lines. Schematics of genomic target loci before (top) and after (bottom) HPV integration in HNSCC cell lines (A) UM-SCC-47 and (B) UPCI:SCC090, chromosome 6. Target gene schematic and connectivity map features are as described in the Figure 4 legend. HPV breakpoint numbers are listed in Supplemental Table 3. These schematics including the viral insertions are not drawn to scale. A short inversion in the viral sequence flanking breakpoint 3 is not shown. (Parentheses) Genomic segments with indicated fold amplification (x N) calculated from WGS data; (upside-down letters) inverted segments. See Supplemental Figure 9 for connectivity maps for both UD-SCC-2 and UPCI:SCC090, chromosome 9.
Figure 6.
Figure 6.
Focal structural variations are associated with HPV integrants in primary tumors. Schematics depict HPV-associated genomic structural variation in primary tumors of the (A–C) tongue (i.e., Tumor A) and (D–F) tonsil (i.e., Tumor B). (A,D) WGS coverage histogram features are as described in Figure 3 legend. (B,D,E) Target gene schematic and connectivity map features are as described in Figure 4 legend. (C) Looping model for HPV-associated structural variation in Tumor A. See Figure 4 legend. (E) Chromosomal translocation structure depicting multiple connections between segments on chromosomes 11 and 8, associated with HPV integrants (red arrows). (F) Scatterplots showing WGS coverage in 50-kb blocks on chromosomes 11 and 8, to estimate (y-axis, left) chromosomal ploidy and (right) ratios of observed local coverage versus mean autosomal coverage. (Gray vertical dots) Centromere; (red arrows) HPV insertion sites.
Figure 7.
Figure 7.
Focal HPV-associated genomic instability disrupts gene expression by diverse mechanisms. Disruption of DIAPH2 in UD-SCC-2 cells (A–E) and of TP63 in UM-SCC-47 cells (F–I) by HPV-associated genomic variation. (A) Mapped RNA-seq read histograms show 5′ expression of DIAPH2 transcript (RefSeq NM006729) in control CAL 27 (top) but not in UD-SCC-2 cells (bottom). Maximal read counts, chromosomal coordinates, and exon numbers are indicated. Truncated 3′ transcripts are overexpressed by fourfold in UD-SCC-2 cells. (B) Resolved linear structure of DIAPH2 locus after HPV integration, displaying (top and inset, middle; red arrows) direction of HPV integrants, not drawn to scale; (red and white numbers) HPV coordinates. (Bottom) Mapped viral–host fusion transcripts identified by 3′ RACE and RT-PCR. (C) Northern blot probed against DIAPH2 3′ cDNA demonstrates aberrant transcripts (arrows) in comparison to CAL 27 and UPCI:SCC090 controls. (D) Western blot showing that the protein translated from DIAPH2, i.e., diaphanous-related formin 2, is markedly reduced compared with control (top); GAPDH loading control (bottom). (E) Northern blot probed against HPV16 E7 demonstrating fusion transcripts in UD-SCC-2 and UM-SCC-47. (F) Histograms of mapped RNA-seq reads show expression of the 5′ end of TP63 in control CAL 27 but not in UM-SCC-47 cells. (G) Resolved linear structure of TP63 locus after HPV integration (top), not drawn to scale. Viral–host fusion transcripts detected by 3′ RACE (bottom) demonstrate HPV-associated gene disruption. (H) Northern blot probed against the 3′ end of TP63, showing truncated transcripts in UM-SCC-47 cells. (I) Western blot showing aberrant expression of 25-kDa p63 carboxy-terminal protein in UM-SCC-47 in comparison to 67-kDa conventional protein in UPCI:SCC090 and SCC-25 cells; (bottom) beta-actin loading control. See also Supplemental Figures 10 and 11.

Similar articles

Cited by

References

    1. The 1000 Genomes Project Consortium 2010. A map of human genome variation from population-scale sequencing. Nature 467: 1061–1073 - PMC - PubMed
    1. Adey A, Burton JN, Kitzman JO, Hiatt JB, Lewis AP, Martin BK, Qiu R, Lee C, Shendure J 2013. The haplotype-resolved genome and epigenome of the aneuploid HeLa cancer cell line. Nature 500: 207–211 - PMC - PubMed
    1. Agrawal N, Frederick MJ, Pickering CR, Bettegowda C, Chang K, Li RJ, Fakhry C, Xie TX, Zhang J, Wang J, et al. 2011. Exome sequencing of head and neck squamous cell carcinoma reveals inactivating mutations in NOTCH1. Science 333: 1154–1157 - PMC - PubMed
    1. Ballo H, Koldovsky P, Hoffmann T, Balz V, Hildebrandt B, Gerharz CD, Bier H 1999. Establishment and characterization of four cell lines derived from human head and neck squamous cell carcinomas for an autologous tumor-fibroblast in vitro model. Anticancer Res 19: 3827–3836 - PubMed
    1. Bergholz J, Xiao ZX 2012. Role of p63 in development, tumorigenesis and cancer progression. Cancer Microenviron 5: 311–322 - PMC - PubMed

Publication types

MeSH terms

Substances