. 2014 Aug;69(8):923-33.
doi: 10.1093/gerona/glt133. Epub 2013 Nov 7.

Expression of DNA methyltransferases is influenced by growth hormone in the long-living Ames dwarf mouse in vivo and in vitro

Affiliations

Expression of DNA methyltransferases is influenced by growth hormone in the long-living Ames dwarf mouse in vivo and in vitro

Vanessa L Armstrong et al. J Gerontol A Biol Sci Med Sci. 2014 Aug.

Abstract

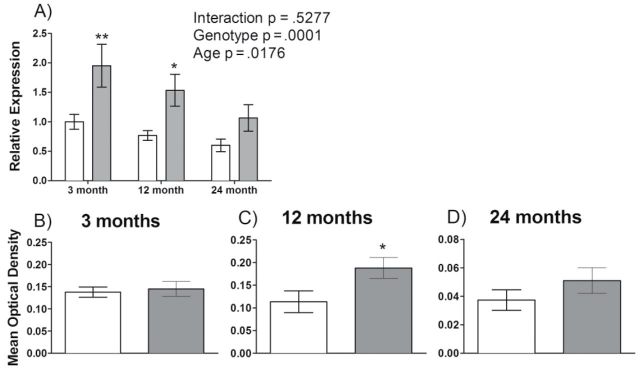
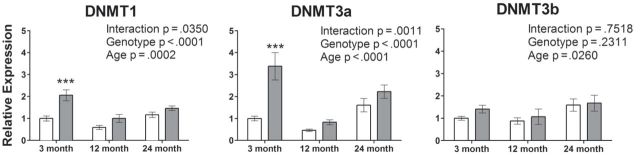
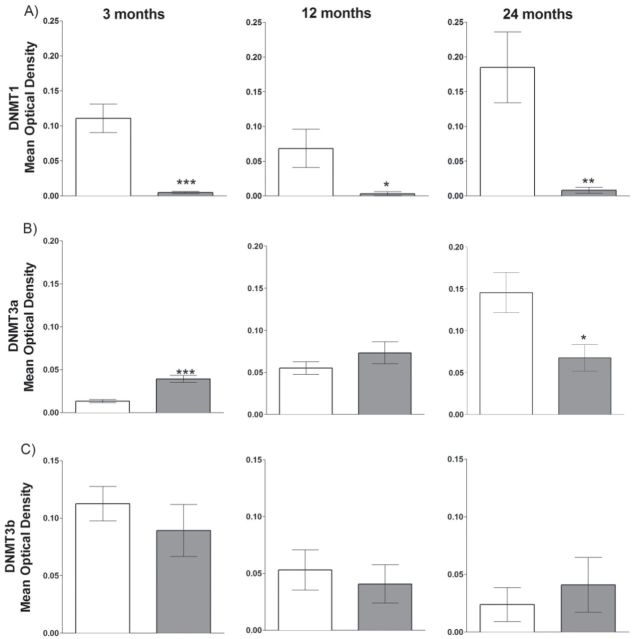
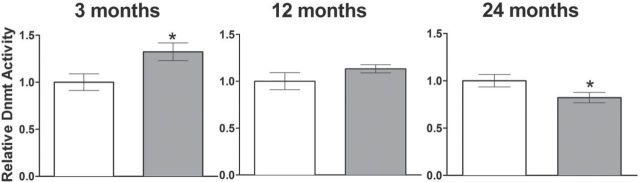
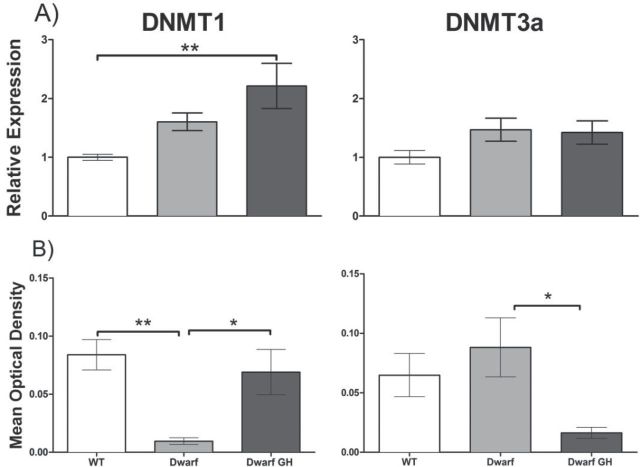
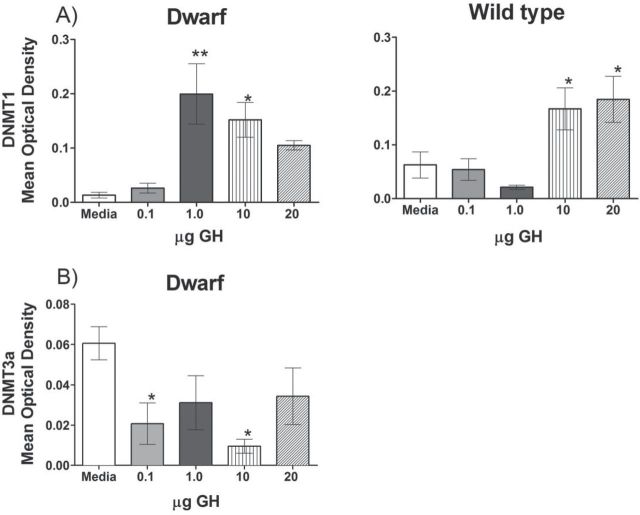
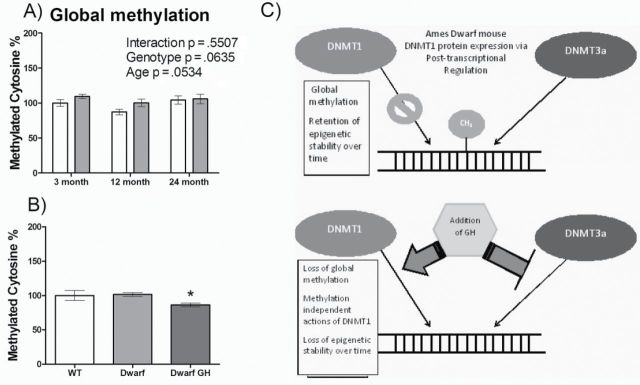
Methyltransferase expression and DNA methylation are linked to aging and age-related disease. We utilized 3-, 12-, and 24-month-old Ames dwarf and their wild-type siblings to examine the genotype and age-related differences in the expression of methyltransferase enzymes related to DNA methylation in the liver, glycine-N-methyltransferase and DNA methyltransferase (DNMT). We found that DNMT proteins and transcripts are differentially expressed in dwarf mice compared with wild-type siblings that can be attributed to age and/or genotype. However, DNMT1 protein expression is drastically reduced compared with wild-type controls at every age. DNMT3a protein levels coincide with differences observed in DNMT activity. Growth hormone appears to modulate expression of DNMT1 and 3a in dwarf liver tissue and primary hepatocytes. Therefore, growth hormone may contribute to age-related processes, DNA methylation, and, ultimately, longevity.

Keywords: Aging; Ames dwarf mice; DNA methylation; DNA methyltransferase; Glycine-N-methyltransferase; Liver..


Figures

Figure 1.
Figure 1.
GNMT mRNA and protein expression are higher in Ames dwarf mice compared with their wild-type siblings. (A) Liver GNMT mRNA expression is shown for dwarf (gray bars) and wild-type mice (open bars) at 3, 12, and 24 months of age (n = 7–8). (B) GNMT protein levels at 3 (n = 10–11, p = .7248), (C) 12 (n = 8–10, p = .0408) and (D) 24 months (n = 6–8, p = .6618) of age. Mean optical densities are shown ± SEM. *p < .05 and **p < .01.
Figure 2.
Figure 2.
DNMT1 and DNMT3a mRNA expressions are higher in Ames dwarf mice at 3 months of age. Liver DNMT mRNA expression is shown for wild-type (open bars) and dwarf mice (gray bars) at 3, 12, and 24 months of age (n = 7–8). Mean relative changes in expression are shown ± SEM. ***p < .001.
Figure 3.
Figure 3.
DNMT protein levels in Ames dwarf and wild-type mice liver tissue at 3, 12, and 24 months of age. Wild-type mice represented by open bars and dwarf mice by gray bars. (A) DNMT1 protein differences at 3 months (n = 10–11, p < .0001), 12 months (n = 9, p = .0427), and 24 months (n = 7–9, p = .0015). (B) DNMT3a protein differences at 3 months (n = 10–11, p < .0001), 12 months (n = 12, p = .2464), and 24 months (n = 8, p = .0172). (C) DNMT3b protein differences at 3 months (n = 10, p < .4000), 12 months (n = 11–12, p = .6244), and 24 months (n = 9–10, p = .5621). Mean optical densities are shown ± SEM. *p < .05, **p < .01, and ***p < .001.
Figure 4.
Figure 4.
DNMT1 activity is higher in Ames dwarf mice at 3 months and lower at 24 months than age-matched wild-type siblings. ELISA-based colorimetric activity assay of nuclear liver lysate showing differences in total DNMT activity in 3-month-old (n = 11, p = .0214), 12-month-old (n = 8–11, p = .1704), and 24-month-old (n = 9–12, p = .0491) wild-type (open bars) and Ames dwarf mice (gray bars). Mean activities expressed as optical density per milligram per hour are shown ± SEM. *p < .05.
Figure 5.
Figure 5.
DNMT mRNA and protein expression are altered by growth hormone in Ames dwarf liver. (A) Liver DNMT mRNA expression is shown for wild-type mice injected with saline (n = 10–11, open bars), dwarf mice injected with saline (n = 10–11, gray bars), and dwarf mice injected with growth hormone (n = 10, black bars) at 5–6 months of age. One-way analysis of variance for DNMT1 p = .0054 (left graph) and for DNMT3a p = .1202 (right graph). (B) Western blot analysis of whole liver lysate showing differences in overall DNMT protein expression (n = 5–8). One-way analysis of variance for DNMT1 protein p = .0021 and for DNMT3a protein p = .0367. *p < .05 and **p < .01 using Bonferroni’s Multiple Comparison test. Bars represent means ± SEM.
Figure 6.
Figure 6.
Ames dwarf hepatocytes are more sensitive to growth hormone treatment, which alters DNMT expression. (A) DNMT1 expression in wild-type (one-way analysis of variance, p = .0014) and dwarf (one-way analysis of variance, p = .0026) hepatocytes with increasing concentrations of growth hormone (0, 0.1,1.0, 10, and 20 µg/ml). (B) DNMT3a expression in dwarf (one-way analysis of variance, p = .0464) hepatocytes with increasing concentrations of growth hormone (0, 0.1,1.0, 10, and 20 µg/ml). *p < .05 and **p < .01 using Dunnett’s Multiple Comparison Test to a media-only control. Error bars represent means ± SEM.
Figure 7.
Figure 7.
Global methylation in dwarf mice and in response to in vivo growth hormone treatment. (A) ELISA-based assay of methylated cytosine normalized to 3-month-old wild-type mice is shown for dwarf (gray bars) and wild-type mice (open bars) at 3, 12, and 24 months of age (n = 7–8). (B) Percent methylated cytosine shown for wild-type mice injected with saline (n = 10–11, open bars), dwarf mice injected with saline (n = 10–11, gray bars), and dwarf mice injected with growth hormone (n = 10, black bars) at 5–6 months of age (Kruskal–Wallis test, p = .0392). *p < .05 using Dunn’s Multiple Comparison Test. (C) A simple schematic representing the changes in DNMT protein expression and DNA methylation in Ames dwarf mice liver without (top) and with (bottom) growth hormone treatment.

References

    1. Golbus J, Palella TD, Richardson BC. Quantitative changes in T cell DNA methylation occur during differentiation and ageing. Eur J Immunol. 1990;20:1869–1872 - PubMed
    1. Nishida N, Nagasaka T, Nishimura T, Ikai I, Boland CR, Goel A. Aberrant methylation of multiple tumor suppressor genes in aging liver, chronic hepatitis, and hepatocellular carcinoma. Hepatology. 2008;47:908–918 - PMC - PubMed
    1. Ehrlich M. Expression of various genes is controlled by DNA methylation during mammalian development. J Cell Biochem. 2003;88:899–910 - PubMed
    1. Holliday R. Epigenetics: an overview. Dev Genet. 1994;15:453–457 - PubMed
    1. Hashimshony T, Zhang J, Keshet I, Bustin M, Cedar H. The role of DNA methylation in setting up chromatin structure during development. Nat Genet. 2003;34:187–192 - PubMed

Publication types