. 2013 Nov 7;4(11):e906.
doi: 10.1038/cddis.2013.430.

Murine neural stem cells model Hunter disease in vitro: glial cell-mediated neurodegeneration as a possible mechanism involved

Affiliations

Murine neural stem cells model Hunter disease in vitro: glial cell-mediated neurodegeneration as a possible mechanism involved

E Fusar Poli et al. Cell Death Dis. .

Abstract

Mucopolysaccharidosis type II (MPSII or Hunter Syndrome) is a lysosomal storage disorder caused by the deficit of iduronate 2-sulfatase (IDS) activity and characterized by progressive systemic and neurological impairment. As the early mechanisms leading to neuronal degeneration remain elusive, we chose to examine the properties of neural stem cells (NSCs) isolated from an animal model of the disease in order to evaluate whether their neurogenic potential could be used to recapitulate the early phases of neurogenesis in the brain of Hunter disease patients. Experiments here reported show that NSCs derived from the subventricular zone (SVZ) of early symptomatic IDS-knockout (IDS-ko) mouse retained self-renewal capacity in vitro, but differentiated earlier than wild-type (wt) cells, displaying an evident lysosomal aggregation in oligodendroglial and astroglial cells. Consistently, the SVZ of IDS-ko mice appeared similar to the wt SVZ, whereas the cortex and striatum presented a disorganized neuronal pattern together with a significant increase of glial apoptotic cells, suggesting that glial degeneration likely precedes neuronal demise. Interestingly, a very similar pattern was observed in the brain cortex of a Hunter patient. These observations both in vitro, in our model, and in vivo suggest that IDS deficit seems to affect the late phases of neurogenesis and/or the survival of mature cells rather than NSC self-renewal. In particular, platelet-derived growth factor receptor-α-positive (PDGFR-α+) glial progenitors appeared reduced in both the IDS-ko NSCs and in the IDS-ko mouse and human Hunter brains, compared with the respective healthy controls. Treatment of mutant NSCs with IDS or PDGF throughout differentiation was able to increase the number of PDGFR-α+ cells and to reduce that of apoptotic cells to levels comparable to wt. This evidence supports IDS-ko NSCs as a reliable in vitro model of the disease, and suggests the rescue of PDGFR-α+ glial cells as a therapeutic strategy to prevent neuronal degeneration.


Figures

Figure 1
Figure 1
IDS deficit does not critically affect NSC self-renewal. (a) Histogram showing the IDS enzymatic activity in wt and IDS-ko NSCs. Although detectable in wt single stem cells, neurospheres and differentiated, no enzymatic activity could be revealed in IDS-ko cells. (b) Phase-contrast image of a free floating neurospheres culture. Scale bar: 100 μm. (c) Graph showing the proliferation rate of wt NSCs (red, n=2) and IDS-ko NSCs (blue, n=2) when cultured in the presence of both EGF and FGF2. (d) Histogram showing the number of viable wt and IDS-ko NSCs at 0, 24, 48 and 72 h after dissociation. For each line, 2.5 × 10⁵ cells were plated (n=2). (e) Western blot analysis of Notch expression in wt and IDS-ko cells at 0 and 7 div after differentiation. (f and g) Graphs showing the proliferation rate of wt NSCs (red, n=2 cell lines) and IDS-ko NSCs (blue, n=2 cell lines) when cultured only in the presence of EGF (f) or in the presence of FGF2 (g). All results are presented as the average of the two IDS-ko and of the two wt NSC lines, respectively. Values are means±S.E.M
Figure 2
Figure 2
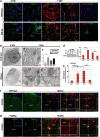
Lysosomal accumulation in differentiated IDS-ko NSCs and in mature neurogenic areas of both murine and human brains affected by MPSII. (a) Confocal microscopy images of wt and IDS-ko NSCs at 0 div and after 7 div differentiation stained against lysosome marker Lamp1 (scale bar: 10–15 m; inset scale bar: 5–8 μm). Scale bars: 75 μm: in insets: 11–15 μm. (b) Transmission electron microscopy analysis in wt and IDS-ko cells at stem (0 div) and differentiated (7 div) stage. Scale bars: 6 μm; in inset: 1.7–2.3 μm. (c) Quantification of average lysosomal area and diameter (Feret) confirmed the presence of macro-lysosomal organelles in IDS-ko differentiated cells. Values are means±S.E.M. (d and e) Western blot analysis (d) and enzymatic activity assay (e) of IDS in wt cells at 0, 3, 4 and 7 div. The differences among all the values were statistically not significant unless indicated (*P≤0.05, **P≤0.01, ***P≤0.001); Student's t-test for all experiments was applied. (f) Confocal microscopy images of wt and IDS-ko mouse brain cortex stained against Lamp1. Scale bars: 75 μm. Zoomed images scale bars: 11–15 μm. (g) Confocal microscopy images of brain cortex from a healthy and Hunter patient stained against Lamp1. Scale bars: 75 μm; in inset: 17–25 μm. Zoomed images scale bars: 15–31 μm
Figure 3
Figure 3
Effect of cell density over IDS-ko NSCs differentiation. (a–f) Coimmunostaining for caspase3+ and ubiquitin with the neural differentiation markers β-tubIII, GFAP and GalC of wt and IDS-ko NSCs at 0 and 17 div of differentiation under HD (1.25 × 10⁴ cells/cm2) and LD (6.5 × 10³ cells/cm2) cell density conditions. (a) Confocal microscopy images showing the coimmunostaining of caspase3 marker with GFAP, GalC or β-tubIII under HD or low LD conditions. Scale bar: 100 μm. (b) Quantification of GFAP+, β-tubIII+ and GalC+ cells over total DAPI+ nuclei under HD and LD conditions. (c) Quantification of caspase3+ cells over total DAPI+ nuclei under HD and LD conditions. (d) Quantification of GFAP+/caspase3+, β-tubIII/caspase3+, GalC+/caspase3+ cells over total caspase3+ cells under HD and LD conditions. (e) Confocal microscopy images showing the immunostaining of ubiquitin+ marker. Scale bar: 100 μm. (f) Quantification of ubiquitin+ cells over total DAPI+ nuclei under HD and LD conditions. (g) Confocal microscopy images showing the presence of caspase3+ cells in wt (upper left) and IDS-ko (upper right) mouse cortex. Scale bar: 75 μm; in inset: 11.72 μm. Quantification of caspase3+ cells over total DAPI+ nuclei (bottom left) and colocalization with glial markers GFAP (bottom center) and MBP (bottom right). Scale bars: 21, 10 μm. (h) Confocal microscopy images showing the presence of ubiquitin+ cells in wt (upper left) and IDS-ko (upper right) mouse cortex. Scale bar: 75 μm. Inset scale bar: 16 μm. Quantification of ubiquitin+ cells over total DAPI+ nuclei (bottom left) and colocalization with GFAP (bottom center) and MBP (bottom right). Scale bar: 13.7 μm. (i) Confocal microscopy images showing the presence of caspase3+ cells in wt (upper left) and Hunter (upper right) human cortex (end stage). Scale bar: 75 μm. Quantification of caspase3+ cells over total DAPI+ nuclei (bottom left) and colocalization with GFAP (bottom center), MBP (bottom right) and neuronal marker β-tubIII (bottom right). Scale bar: 10–14 μm. (j) Confocal microscopy images showing the presence of ubiquitin+ aggregates in wt (upper left) and Hunter (upper right) human cortex (end stage). Scale bar: 75 μm. Quantification of caspase3+ cells over total DAPI+ nuclei (bottom left) and colocalization with GFAP (bottom center), MBP (bottom right) and β-tubIII (bottom right). Scale bars: 16–18 μm. Student's t-test was applied, the differences among all the values were statistically not significant unless indicated (*P≤0.05,**P≤0.01, ***P≤0.001) values are means±S.E.M. Casp, active caspase 3; Ub, ubiquitin
Figure 4
Figure 4
Neurogenic pattern of IDS-ko mouse brain. (a) Hematoxylin–eosin histochemical staining of wt and IDS-ko mouse brains. Scale bar in top and bottom pictures: 100 μm; scale bar in center pictures (cortex): 50 μm. (b–d) Confocal microscopy images of SVZ, cc, CTX and OB immunostained with antibodies against the neural markers β-tubIII (b), MAP2 (c), Dcx (c) and MBP (d). A disorganization of β-tubIII+, MAP2+ and MBP+ cells is particularly pronounced in cortex (white arrows). Scale bars: 75 μm. (e) Confocal microscopy images of wt and IDS-ko mouse brain immunostained for the astroglial GFAP (e) marker. The morphology of GFAP+ cells is radial glia-like in IDS-ko SVZ (upper right), whereas star-shaped in wt SVZ (upper left). Scale bars: 75–100 μm; in insets: 10–12 μm. (f) Quantification of GFAP+ cells over total DAPI+ nuclei confirms a remarkable astrogliosis in all the brain areas analyzed. Student's t-test was applied, values are means±S.E.M. cc, corpus callosum; SEPT, septum; CTX, cortex; OB, olfactory bulbs; SVZ, subventricular zone
Figure 5
Figure 5
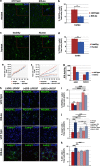
IDS deficiency affects the number of PDGFR-α+ progenitors both in mouse and in human: potential therapeutic effects of PDGF. (a) Confocal microscopy images of wt and IDS-ko mice brain cortex immunostained for the glial PDGFRα marker. Scale bar: 75 μm. Inset images show the difference between the wt long-branching and the mutant round-shaped morphologies of PDGFRα+ cells. Scale bars: 26 μm in wt and 8 μm in IDS-ko. (b) Quantification of PDGFRα+ cells over total DAPI+ cells. (c) Confocal microscopy images of wt and Hunter human cortex immunostained for the glial PDGFRα marker. Scale bar: 75 μm. Inset images show the difference between the wt long-branching and the mutant disrupted morphologies of PDGFRα+ cells. Scale bars: 22 μm in healthy and 11 μm in Hunter. (d) Quantification of PDGFRα+ cells over total DAPI+ cells. (e and f) Graphs showing the proliferation rate of wt NSC (red, orange) and IDS-ko NSC (blue, light blue) when cultured in the presence of both EGF and FGF2 (E) or FGF2 alone (f) with or without addition of PDGF. (g) Enzymatic IDS activity assay in wt and IDS-ko murine NSCs and related supernatants after addition of IDS to the culture medium for 5 div, showing the rescue of IDS activity in IDS-ko cells. (h) Confocal microscopy images of wt and IDS-ko NSCs cultured and differentiated for 10 div with or without addition of IDS or PDGF to the culture media and immunostained with antibodies against PDGFRα and Lamp1. (i–k) Histograms showing the percentage of PDGFRα+ (i), Caspase 3+ (j) and ubiquitin+ (k) cells over total nuclei in untreated, PDGF- or IDS-treated wt and IDS-ko NSCs differentiated for 10 div.The differences among all the values were statistically not significant unless indicated (*P≤0.05, **P≤0.01, ***P≤0.001); Student's t-test was applied for b, d and g, whereas one-way ANOVA followed by Student's t-test for i, j and k experiments

Similar articles

Cited by

References

    1. Muenzer J. Overview of the mucopolysaccharidoses. Rheumatology (Oxford) 2011;50:v4–v12. - PubMed
    1. Scarpa M, Almassy Z, Beck M, Bodamer O, Bruce IA, De Meirleir L, et al. Mucopolysaccharidosis type II: European recommendations for the diagnosis and multidisciplinary management of a rare disease. Orphanet J Rare Dis. 2011;6:72. - PMC - PubMed
    1. Muenzer J, Beck M, Eng CM, Giugliani R, Harmatz P, Martin R, et al. Long-term, open-labeled extension study of idursulfase in the treatment of Hunter syndrome. Genet Med. 2011;13:95–101. - PubMed
    1. Muenzer J, Beck M, Giugliani R, Suzuki Y, Tylki-Szymanska A, Valayannopoulos V, et al. Idursulfase treatment of Hunter syndrome in children younger than 6 years: results from the Hunter Outcome Survey. Genet Med. 2011;13:102–109. - PubMed
    1. Muenzer J, Bodamer O, Burton B, Clarke L, Frenking GS, Giugliani R, et al. The role of enzyme replacement therapy in severe Hunter syndrome-an expert panel consensus. Eur J Pediatr. 2012;171:181–188. - PMC - PubMed

Publication types

MeSH terms