. 2013 Nov 7;4(11):e915.
doi: 10.1038/cddis.2013.442.

An EMT spectrum defines an anoikis-resistant and spheroidogenic intermediate mesenchymal state that is sensitive to e-cadherin restoration by a src-kinase inhibitor, saracatinib (AZD0530)

Affiliations

An EMT spectrum defines an anoikis-resistant and spheroidogenic intermediate mesenchymal state that is sensitive to e-cadherin restoration by a src-kinase inhibitor, saracatinib (AZD0530)

R Y-J Huang et al. Cell Death Dis. .

Abstract

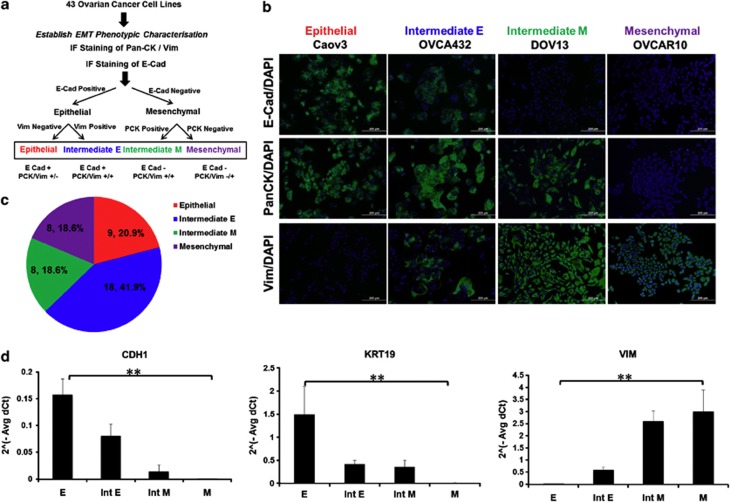
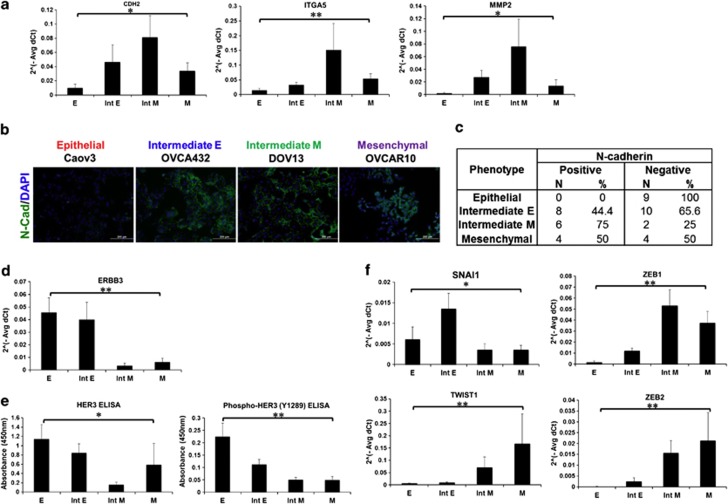
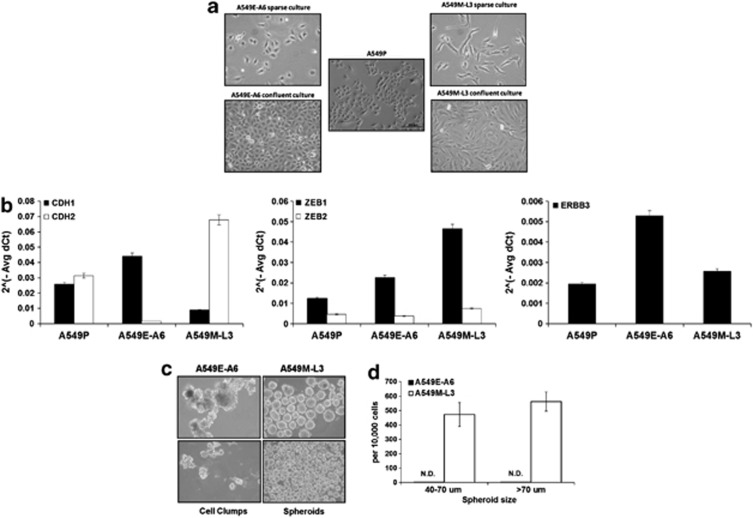
The phenotypic transformation of well-differentiated epithelial carcinoma into a mesenchymal-like state provides cancer cells with the ability to disseminate locally and to metastasise. Different degrees of epithelial-mesenchymal transition (EMT) have been found to occur in carcinomas from breast, colon and ovarian carcinoma (OC), among others. Numerous studies have focused on bona fide epithelial and mesenchymal states but rarely on intermediate states. In this study, we describe a model system for appraising the spectrum of EMT using 43 well-characterised OC cell lines. Phenotypic EMT characterisation reveals four subgroups: Epithelial, Intermediate E, Intermediate M and Mesenchymal, which represent different epithelial-mesenchymal compositions along the EMT spectrum. In cell-based EMT-related functional studies, OC cells harbouring an Intermediate M phenotype are characterised by high N-cadherin and ZEB1 expression and low E-cadherin and ERBB3/HER3 expression and are more anoikis-resistant and spheroidogenic. A specific Src-kinase inhibitor, Saracatinib (AZD0530), restores E-cadherin expression in Intermediate M cells in in vitro and in vivo models and abrogates spheroidogenesis. We show how a 33-gene EMT Signature can sub-classify an OC cohort into four EMT States correlating with progression-free survival (PFS). We conclude that the characterisation of intermediate EMT states provides a new approach to better define EMT. The concept of the EMT Spectrum allows the utilisation of EMT genes as predictive markers and the design and application of therapeutic targets for reversing EMT in a selective subgroup of patients.


Figures

Figure 1
Figure 1
Identification of epithelial–mesenchymal phenotypes and EMT Spectrum in SGOCL(43). (a) The EMT phenotypic characterisation was achieved using IF staining of E-cadherin (E-cad), pan-cytokeratin (PCK) and Vimentin (Vim). Four phenotypes were identified: Epithelial (E-cad-positive, PCK-positive, Vim-negative), Intermediate E (E-cad-positive, PCK-positive, Vim-positive), Intermediate M (E-cad-negative, PCK-positive, Vim-positive) and Mesenchymal (E-cad-negative, PCK-negative, Vim-positive). (b) Phase contrast images (Phase) and IF staining of E-cadherin (E-cad), Pan-cytokeratin (PCK) and Vimentin (Vim) in Caov3, OVCA432, DOV13 and OVCAR10, representing Epithelial, Intermediate E, Intermediate M and Mesenchymal phenotypes, respectively. Scale bar=200 μm. (c) Pie chart of the number and percentage distribution of four phenotypes in SGOCL(43). (d) Plot of QPCR expressions (2^- Avg ΔCt) of the key EMT genes E-cadherin (CDH1), cytokeratin 19 (KRT19) and vimentin (VIM), showed a gradient along Epithelial (e), Intermediate E (Int E), Intermediate M (Int M) and Mesenchymal (M) phenotypes. Statistical significance at **P<0.05 in both ANOVA and Kruskal–Wallis test
Figure 2
Figure 2
The Intermediate M phenotype is hallmarked by higher N-cadherin and ZEB1 and lower ERBB3 expressions. (a) Plot of QPCR expressions (2^- Avg ΔCt) of CDH2, ITGA5, MMP2 showing the peak expression at Intermediate M (Int M) phenotype. Statistical significance at *P<0.05. (b) IF staining of N-cadherin (N-cad) in Caov3, OVCA432, DOV13 and OVCAR10 representing Epithelial, Intermediate E, Intermediate M and Mesenchymal phenotypes, respectively. Scale bar=200 μm. (c) Distribution of N-cadherin IF positivity among four phenotypes in number (N) and percentage (%). (d) Plot of QPCR expressions (2^- Avg ΔCt) of v-erb-b2 erythroblastic leukaemia viral oncogene homologue 3 (ERBB3) showed lowest expression in the Intermediate M phenotype. Statistical significance at **P<0.05 at both ANOVA and Kruskal–Wallis test. (e) ELISA (f) Plot of QPCR expressions (2^- Avg ΔCt) of snail homologue 1 (SNAI1), zinc-finger E-box-binding homeobox 1 (ZEB1), twist homologue 1 (TWIST1) and zinc-finger E-box-binding homeobox 2 (ZEB2) showing differential expression peaks in Intermediate E (Int E), Intermediate M (Int M) and Mesenchymal (M) phenotypes, respectively. Statistical significance at **P<0.05 in both ANOVA and Kruskal–Wallis tests; Statistical significance at *P<0.05 in either ANOVA or Kruskal–Wallis test
Figure 3
Figure 3
Anoikis resistance, spheroid formation and tumour formation in selected cell lines of SGOCL(43). (a) Plot of viability index (y axis) measured by MTT absorbance ratio between 96 and 48 h in ultra-low attachment plates in Epithelial, Intermediate E, Intermediate M and Mesenchymal phenotypes. Error bars represented S.E.M. from triplicate cultures. (b) Distribution of viability index among four phenotypes in number (N) and percentage (%). (c) Summary of aggregate (A) or spheroid (S) formation in suspension cultures in selected cell lines from SGOCL(43). (d) Images of cell aggregates and spheroids in selected cell lines from SGOCL(43). (e) Plot of number of spheroid formed per 1000 cells (y axis) in SKOV3 and OV90 in primary (10) and tertiary (30) spheroid (x axis) cultures. Error bars represented S.E.M from triplicate cultures. Statistical significance at **P<0.01.Statistical significance at *P<0.05. (f) Growth curve of SKOV3 xenograft volume (y axis) in nude mice over time (x axis). Error bars represented S.D. from 6 subcutaneous engraftments in three mice
Figure 4
Figure 4
EMT heterogeneity in A549 cells. (a) Phase contrast images of two phenotypically distinct clones presenting epithelial (A549E-A6; left) and mesenchymal (A549M-L3; right) in sparse (upper) and confluent (lower) cultures compared with parental A549 cultures (A549P; centre). (b) Plot of QPCR expressions (2^- Avg ΔCt) of CDH1 and CDH2 (left), ZEB1 and ZEB2 (middle), and ERBB3 (right) in A549P, A549E-A6 and A549M-L3 cells. Error bars represented S.E.M. from triplicate cultures. (c) Images of spheroid formation in A549E-A6 (left) showing only cell clumps and in A549M-L3 (right) showing well-formed spheres. (d) Qualitative graph showing spheroid-forming numbers (y axis) in A549E-A6 and A549M-L3 cells. (N.D. indicates non-detectable). Error bars represented S.E.M. from triplicate cultures
Figure 5
Figure 5
Reversibility of EMT and effects on anoikis resistance and spheroid formation by AZD0530 in Intermediate M SKOV3 cells. (a) Phase contrast images of OVCAR3, OVCA433, SKOV3 and OVCAR10 in control (upper panels)- or AZD0530 (lower panels)-treated cultures. Scale bar=100 μm. (b) Plot of QPCR expression fold changes (y axis) of CDH1 in control (blank box) or AZD0530 (solid box)-treated OVCAR3, -OVCA433, -SKOV3 and -OVCAR10 cells. (c) Plot of E-cadherin promoter activity fold changes (y axis) in control (blank box) or AZD0530 (solid box)-treated OVCAR3, -OVCA433, -SKOV3 and -OVCAR10 cells. (d) Western blots of E-cadherin (upper panel) and β-actin (lower panel) in control (−)- or AZD0530-treated (+) PEO1, -OVCA433, -SKOV3 and -OVCAR10 cells. (e) Representative images of immunohistochemistry staining of E-cadherin in control or AZD0530-treated SKOV3 xenografts. (f) Plot of viability index (y axis) of control (blank box) or AZD0530 (solid box)-treated SKOV3 cells in tissue culture plates (TCPs) and ULAS plates (x axis). (g) Plot of number of spheroid formed per 1000 cells (y axis) in control (blank box)- or AZD0530 (solid box)-treated SKOV3 cells. (h) Plot of average spheroid diameter (y axis) in control (blank box) or AZD0530 (solid box)-treated SKOV3 cells. (i) Images of spheroid formation in control or AZD0530-treated SKOV3 cells. Error bars represented S.E.M. from triplicate cultures. Statistical significance at **P<0.01. Statistical significance at *P<0.05
Figure 6
Figure 6
EMT Signature identifies an Intermediate subgroup of ovarian carcinoma patients with shorter progression-free survival. (a) Venn diagram of CDH1, ERBB3 and ZEB1 signature showed 36 intersected common transcript IDs. (b) Hierarchical clustering of ovarian carcinoma collection GSE9891 using the 33-gene EMT Signature revealed four clusters Epithelial (red), Intermediate E (blue), Intermediate M (green) and Mesenchymal (purple). (c) Kaplan–Meier Survival plot for PFS at 5 years of GSE9891 collection separated into Epithelial (e), Intermediate E (Int E), Intermediate M (Int M) and Mesenchymal (M) clusters. (d) P-value summary of PFS analysis using log-rank test for paired comparison among four phenotypes. (e) Summary of PFS difference in RMST analysis for paired comparison among four phenotypes
Figure 7
Figure 7
A proposed simplified scheme of EMT heterogeneity in carcinoma representing tumours harbouring a different EMT status as a function of undergoing various degrees of EMT process (No, Partial and Full EMT) under the cue of EMT gradient to acquire different phenotypes (Epithelial, Intermediate, and Mesenchymal)

Similar articles

Cited by

References

    1. Thiery JP. Epithelial-mesenchymal transitions in tumour progression. Nat Rev Cancer. 2002;2:442–454. - PubMed
    1. Thiery JP. Metastasis: alone or together. Curr Biol. 2009;19:R1121–R1123. - PubMed
    1. Thiery JP, Sleeman JP. Complex networks orchestrate epithelial-mesenchymal transitions. Nat Rev Mol Cell Biol. 2006;7:131–142. - PubMed
    1. Kurrey NK, Jalgaonkar SP, Joglekar AV, Ghanate AD, Chaskar PD, Doiphode RY, et al. Snail and slug mediate radioresistance and chemoresistance by antagonizing p53-mediated apoptosis and acquiring a stem-like phenotype in ovarian cancer cells. Stem Cells. 2009;27:2059–2068. - PubMed
    1. Kudo-Saito C, Shirako H, Takeuchi T, Kawakami Y. Cancer metastasis is accelerated through immunosuppression during Snail-induced EMT of cancer cells. Cancer Cell. 2009;15:195–206. - PubMed

Publication types