. 2013:4:2745.
doi: 10.1038/ncomms3745.

RNA editing regulates transposon-mediated heterochromatic gene silencing

Affiliations

RNA editing regulates transposon-mediated heterochromatic gene silencing

Yiannis A Savva et al. Nat Commun. 2013.

Abstract

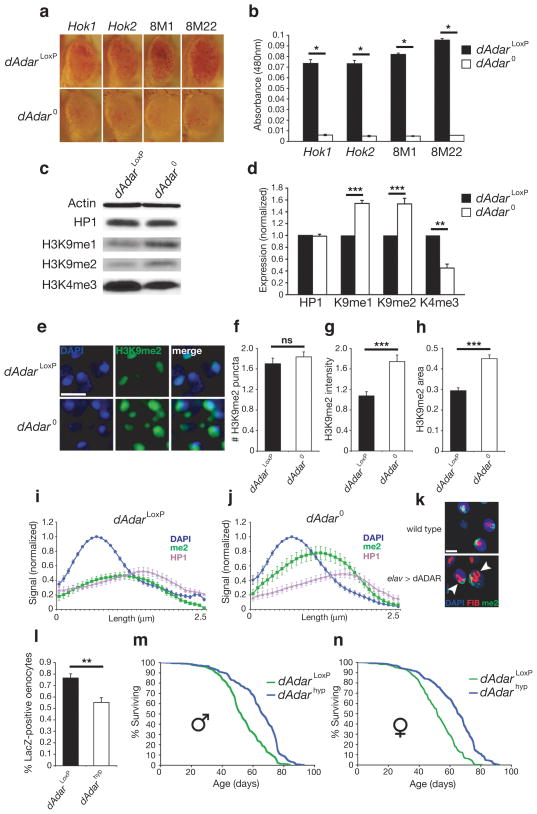
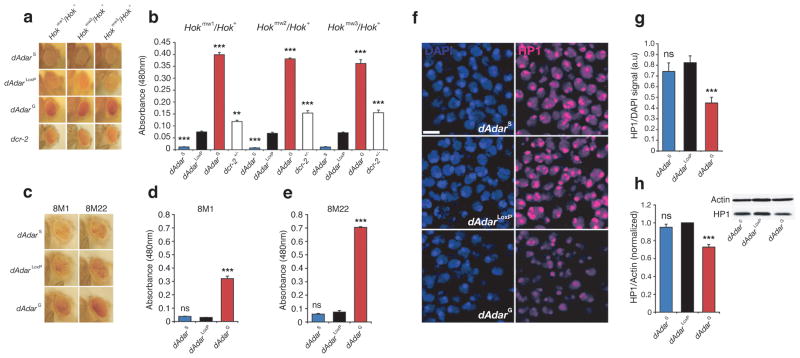
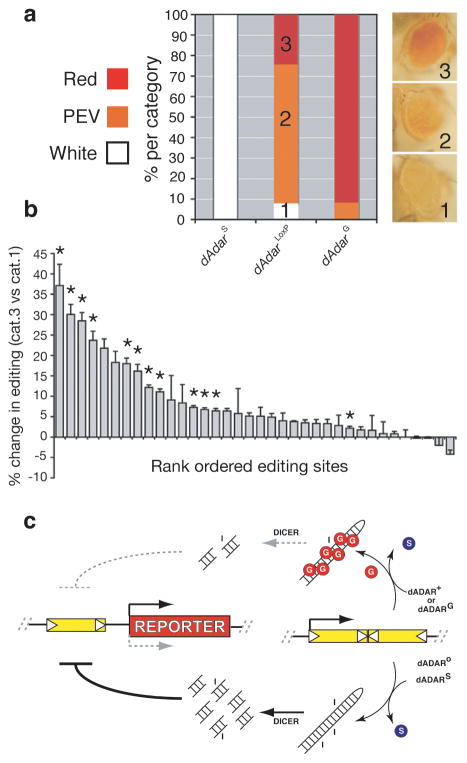
Heterochromatin formation drives epigenetic mechanisms associated with silenced gene expression. Repressive heterochromatin is established through the RNA interference pathway, triggered by double-stranded RNAs (dsRNAs) that can be modified via RNA editing. However, the biological consequences of such modifications remain enigmatic. Here we show that RNA editing regulates heterochromatic gene silencing in Drosophila. We utilize the binding activity of an RNA-editing enzyme to visualize the in vivo production of a long dsRNA trigger mediated by Hoppel transposable elements. Using homologous recombination, we delete this trigger, dramatically altering heterochromatic gene silencing and chromatin architecture. Furthermore, we show that the trigger RNA is edited and that dADAR serves as a key regulator of chromatin state. Additionally, dADAR auto-editing generates a natural suppressor of gene silencing. Lastly, systemic differences in RNA editing activity generates interindividual variation in silencing state within a population. Our data reveal a global role for RNA editing in regulating gene expression.


Conflict of interest statement

COMPETING FINANCIAL INTERESTS

The authors declare no competing financial interests.

Figures

Figure 1
Figure 1. Drosophila ADAR localizes to the Caps locus in salivary gland polytene nuclei
(a–c) 3rd instar larval polytene nuclei in a, magnified in b, and chromosomal squashes in c expressing dADAR-HA driven by elav-Gal4 and immuno-stained for the nucleolar marker Fibrillarin (FIB). (d) Transgenic dADAR driven by elav-Gal4 localizes to the Caps locus, labeled using a FISH DNA probe. Chromosome 4 is denoted in d. Arrows point to prominent localization of dADAR-HA on the tip of chromosome 4. Scale bars, 20 μm.
Figure 2
Figure 2. Diverse dsRNA-binding proteins bind to a dsRNA source within the Caps locus
(a–c) Transgenic expression of dADAR-HA in polytene chromosomes not treated with RNAse in a, treated with Ribonuclease A (RNAse A) that cleaves single-stranded RNA in b, or treated with Ribonuclease III (RNAse III) that cleaves double-stranded RNA in c. (b) dADAR binding on the fourth chromosome is not abolished by RNAse A digestion (arrow). (c) RNAse III digestion results in the loss of dADAR binding on chromosome 4 (arrow) without abolishing nucleolar localization. (d) Transgenic Hydra magnipapillata ADAR-HA (HmADAR) driven by elav-Gal4 localizes to the Caps locus. (e) HmADAR transgene localization on a single polytene spread revealed numerous other binding locations (4 examples shown) throughout the genome (arrows). (f) Elav-Gal4-driven B2-FLAG similarly localizes to the Caps locus. Arrows in a–c, and f point to prominent localization of dsRNA-binding proteins on the tip of chromosome 4. Scale bars, 20 μm.
Figure 3
Figure 3. dADAR binds to dsRNA formed by inverted Hoppel elements
(a) Schematic of the UAS-miniCAPS construct. (b) Co-localization of dADAR and Hoppel elements on chromosome 4 labeled using FISH. (c–f) dADAR does not bind to non-expressed pCasper[miniCAPS] in c, magnified in d, but binds to UAS-miniCAPS driven by elav-Gal4 in e, magnified in f. Arrows point to miniCAPS insertions labeled via FISH for mini-white+. (g) Schematic of targeting construct used to delete Hoppel elements using homologous recombination. *: Edited exon of Caps. (h) Expression of dADAR-HA in a Hokmw/Hok+ background. FISH for mini-white+ (white) indicates deleted chromatid of chromosome 4, allowing visualization of lack of dADAR binding to the Hokmw chromatid. Chromosome 4 is denoted in each image. Scale bars, 20 μm. (i) Pie charts indicating editing levels at adenosines within the three Hoppel repeats. +/− signs denote the orientation of transcription.
Figure 4
Figure 4. Regulation of chromosome 4 architecture and transcription by the Hok locus
(a) Representative images of variegating and non-variegating mini-white expression in male eyes. Hok1–3 indicate independent Hok alleles. Scale bar, 150 μm. (b) Quantification of eye color levels via spectral absorbance. n = 3–4 independent replicates. (c) Light microscope images of chromosome 4 (upper panels) and Hoppel FISH signals (lower). Arrow points to a prominent chromosomal band often observed in HokLoxP homozygotes. (d) Confocal images showing HP1 and POF localization on chromosome 4 in larvae with two (upper), one (middle) or zero (lower) copies of Hok. (e–f) Mean HP1 and POF signals normalized to DAPI intensity. n = 10/genotype. (g–i) Expression of two independent chromosome 4 reporters of PEV in wild type and HokLoxP male eyes in g, quantified in h–i in three independent Hok allelic backgrounds. Scale bar, 150 μm. n = 3 independent replicates. (j) Localization of ProtoP elements on chromosome 4 and the chromocenter using a DNA FISH probe. Arrow denotes a prominent band on chromosome 4 coincident with a strong ProtoP signal. (k) Mean ProtoP expression in 2–3 day old male heads heterozygous or homozygous for two independent HokLoxP alleles. n = 4 independent qPCRs. Error bars indicate s.e.m. *P < 0.005, **P < 0.0005, ***P < 0.0005; b, e, f: one-way ANOVA with Dunnett post-hoc test; h–i: Mann-Whitney U-test. Scale bars, 10 μm.
Figure 5
Figure 5. RNA editing regulates heterochromatin gene silencing
(a) Representative images of control (dAdarLoxP) or dAdar null (dAdar0) male eyes expressing mini-white reporters of PEV located on chromosome 4, including two independent Hokmw alleles. Scale bar, 150 μm. (b) Mean pigmentation levels of the four reporters in control and dAdar0 eyes. n = 4 independent replicates. (c) Western blots of silencing and activating chromatin marks in control and dAdar0 head samples. (d) Quantification of HP1 and histone methylation levels, normalized to Actin. n = 7–12 western blots. (e) Confocal slices showing dimethyl H3K9 (H3K9me2) expression in control and dAdar0 adult neuronal nuclei. Scale bar, 5 μm. (f–h) Properties of H3K9me2 puncta in control and dAdar0 adult neuronal nuclei. n = 30 nuclei/genotype. (i–j) Average linear signal intensities for DAPI, H3K9me2 and HP1 immuno-staining across neuronal nuclei in control (n = 25 nuclei) and dAdar0 (n = 20) adult brains (see Methods for details). Values were normalized to the peak DAPI signal. (k) Salivary gland nuclei labeled with antibodies against Fibrillarin (FIB) and H3K9me2 (me2). Note the irregular nucleolar morphology in nuclei over-expressing dADAR (arrows, lower panel) relative to controls (upper panel). Scale bar, 20 μm. (l) Expression of a Lac-Z-based reporter of gene silencing (see Methods) in control (dAdarLoxP) and dAdarhyp oenocytes. n = 30/genotype. (m–n) Lifespan curves for wild type and dAdarhyp males in m and females in n (see Supplementary Table S1 for n-values and statistics). Error bars indicate s.e.m. *P < 0.005, **P < 0.0005, ***P < 0.0005, Mann-Whitney U-test.
Figure 6
Figure 6. dADAR auto-editing generates a suppressor of gene silencing
(a–b) Altered Hokmw expression in males with bi-directional modifications in dAdar auto-editing and in dcr-2 mutants (examples shown in a, quantified in b). Scale bar, 150 μm. n = 4 independent samples. (c–e) Independent PEV reporter expression in dAdar auto-editing mutants. n = 5 independent samples. Scale bar, 150 μm. (f) Confocal slices showing HP1 expression in neuronal nuclei from control and dAdar auto-editing mutant adult male brains. Scale bar, 5 μm. (g) Mean HP1 levels in control and auto-editing mutant nuclei, normalized to the DAPI signal. n = 22–25 nuclei/genotype. (h) Representative western blots (inset) and quantification of HP1 protein levels in control and auto-editing mutant head samples. Values were normalized to Actin loading controls. Mutant HP1 levels are normalized to dAdarLoxp controls. n = 8 independent western blots. Error bars indicate s.e.m. *P < 0.005, **P < 0.0005, ***P < 0.0005, one-way ANOVA with Dunnett post-hoc test.
Figure 7
Figure 7. Inter-individual variation in heterochromatic gene silencing through ADAR activity
(a) Representative examples (right) and percentages of categories of Hokmw/Hok+ PEV reporter expression observed in wild type and dAdar auto-editing mutant backgrounds, n dAdarS =572, n dAdarLoxp =492, and n dAdarG =534. Scale bar, 150 μm. (b) Editing levels at 30 dADAR target adenosines, presented as the % editing in category 3 thorax tissue normalized to mean editing in category 1 thorax tissue for each site. (c) Speculative model of the functional consequences of dADAR auto-editing on PEV reporter expression via differential modulation of the small RNA pathway. Error bars indicate s.e.m. *P < 0.005, **P < 0.0005, ***P < 0.0005, Mann-Whitney U-test.

Similar articles

Cited by

References

    1. Ghildiyal M, Zamore PD. Small silencing RNAs: an expanding universe. Nat Rev Genet. 2009;10:94–108. - PMC - PubMed
    1. Malone CD, Hannon GJ. Small RNAs as guardians of the genome. Cell. 2009;136:656–68. - PMC - PubMed
    1. Watanabe T, et al. Endogenous siRNAs from naturally formed dsRNAs regulate transcripts in mouse oocytes. Nature. 2008;453:539–43. - PubMed
    1. Yang N, Kazazian HH., Jr L1 retrotransposition is suppressed by endogenously encoded small interfering RNAs in human cultured cells. Nat Struct Mol Biol. 2006;13:763–71. - PubMed
    1. Ding SW, Voinnet O. Antiviral immunity directed by small RNAs. Cell. 2007;130:413–26. - PMC - PubMed

Publication types

MeSH terms

LinkOut - more resources