. 2014 Jan;6(1):80-98.
doi: 10.1002/emmm.201302666.

Src is activated by the nuclear receptor peroxisome proliferator-activated receptor β/δ in ultraviolet radiation-induced skin cancer

Src is activated by the nuclear receptor peroxisome proliferator-activated receptor β/δ in ultraviolet radiation-induced skin cancer

Alexandra Montagner et al. EMBO Mol Med. 2014 Jan.

Abstract

Although non-melanoma skin cancer (NMSC) is the most common human cancer and its incidence continues to rise worldwide, the mechanisms underlying its development remain incompletely understood. Here, we unveil a cascade of events involving peroxisome proliferator-activated receptor (PPAR) β/δ and the oncogene Src, which promotes the development of ultraviolet (UV)-induced skin cancer in mice. UV-induced PPARβ/δ activity, which directly stimulated Src expression, increased Src kinase activity and enhanced the EGFR/Erk1/2 signalling pathway, resulting in increased epithelial-to-mesenchymal transition (EMT) marker expression. Consistent with these observations, PPARβ/δ-null mice developed fewer and smaller skin tumours, and a PPARβ/δ antagonist prevented UV-dependent Src stimulation. Furthermore, the expression of PPARβ/δ positively correlated with the expression of SRC and EMT markers in human skin squamous cell carcinoma (SCC), and critically, linear models applied to several human epithelial cancers revealed an interaction between PPARβ/δ and SRC and TGFβ1 transcriptional levels. Taken together, these observations motivate the future evaluation of PPARβ/δ modulators to attenuate the development of several epithelial cancers.


Figures
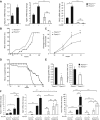
Figure 1
Figure 1
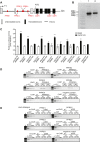
PPARβ/´ is over-expressed and activated upon UV radiation and enhances skin tumour formation and growth. A  Quantification of Pparβ/δ (left), Tgfβ1 (middle) and Plin2 (right) expression by RT-PCR in non-tumoural dorsal skin of chronically irradiated (Ch-UV, +) or non-irradiated (−) Pparβ/δ+/+ and Pparβ/δ−/− mice. Values from non-irradiated dorsal skin of Pparβ/δ+/+ mice (left) or from irradiated dorsal skin of Pparβ/δ−/− mice (right) were set to 1. Means ± SEM of 13 Pparβ/δ+/+ and 9 Pparβ/δ−/− mice are presented. p-values are *p = 0.035 for Pparβ/δ (left); *p = 0.025 and **p = 0.008 for Tgfβ1(middle); **p = 0.078 and ***p = 0.0003 for Plin2 (right) calculated by two-tailed Student's t-test. B,C  Percentage of Pparβ/δ+/+ and Pparβ/δ−/− mice bearing tumours (B) and average number of tumours per mouse (C) measured at the indicated time points of UV exposure. For (C), p-values are *p = 0.025, **p = 0.008, ***p = 0.0001 calculated by two-tailed Student's t-test. Data for 13 Pparβ/δ+/+ and 9 Pparβ/δ−/− mice are presented. D  Percentage of Pparβ/δ+/+ and Pparβ/δ−/− mice involved in the experiment over time. Mice were withdrawn from the experiment based on criteria given in the Material and Methods section. E  Tumour growth rate (left) and final size (right) from Pparβ/δ+/+ and Pparβ/δ−/− mice measured before sacrifice. Means ± SEM for 13 Pparβ/δ+/+ and 9 Pparβ/δ−/− mice are presented. p-values are **p = 0.009 for tumour growth rate (left) and *p = 0.045 for tumour size (right) calculated by two-tailed Student's t-test. F  Measurement of Pparβ/δ (left), Tgfβ1 (middle) and Plin2 (right) expression by RT-PCR in dermis and epidermis compartments of dorsal skin of Pparβ/δ+/+ and Pparβ/δ−/− mice 24 h after acute UV (Ac-UV) irradiation. Values from dermis of non-irradiated dorsal skin of Pparβ/δ+/+ mice (left) or from dermis of Ac-UV dorsal skin of Pparβ/δ−/− mice (middle and right) were set to 1. Means ± SEM for 12 Pparβ/δ+/+and 12 Pparβ/δ−/− mice are presented. Values are representative of three independent experiments; p-values are *p = 0.025, **p = 0.007, ***p = 0.002 for Pparβ/δ; ***p = 0.0003, *p = 0.049, **p = 0.0093, ***p = 0.0041, ***p = 0.0004 from top to bottom for Tgfβ1; ***p = 0.0048, ***p = 0.0013, ***p = 0.0006, ***p = 0.0009, **p = 0.0071, ***p = 0.0035, ***p = 0.0029 from top to bottom and from left to right for Plin2 calculated by two-tailed Student's t-test; ns, not significant.
Figure 2
Figure 2
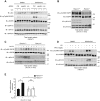
PPARβ/´ promotes Src expression in irradiated skin. A  SrcFyn and Yes mRNA expression by RT-PCR in acutely (Ac-UV, +) and non-irradiated (−) dermis and epidermis of Pparβ/δ+/+ and Pparβ/δ−/− mice. The value from irradiated dermis of Pparβ/δ−/− mice was set to 1. Means ± SEM are presented (n = 6 mice/genotype/group). Data are representative of three independent experiments; p-values are, from top to bottom and from left to right, ***p = 0.0001, ***p = 0.0005, **p = 0.01, **p = 0.008 for Src; ***p = 0.0008, *p = 0.017, ***p = 0.0009 for Fyn; ***p = 0.0004, ***p = 0.0006, ***p = 0.0005, ***p = 0.0004, ***p = 0.0008, ***p = 0.0001, ***p = 0.001 for Yes calculated by two-tailed Student's t-test. B  Right, immunoblot of total Src in Ac-UV and non-irradiated skin of Pparβ/δ+/+ and Pparβ/δ−/− mice. One of three independent experiments is shown (n = 6 mice/genotype/group). GAPDH was used as loading control; IB, immunoblot; left, quantification of the immunoblot (right) of total Src in Ac-UV and non-irradiated skin of Pparβ/δ+/+ and Pparβ/δ−/− mice. Values are normalized to GAPDH, n = 3 mice/group; from left to right, **p = 0.010, 0.009, t-test. C  Src mRNA levels in non-tumoural skin of chronically irradiated (Ch-UV)Pparβ/δ+/+ mice and Pparβ/δ−/− mice. Value from irradiated skin of Pparβ/δ−/− was set to 1. Means ± SEM are given for 13 Pparβ/δ+/+ and 9 Pparβ/δ−/− mice; *p = 0.035, t-test. D  Left, quantification of Src protein from the immunoblot (right) normalized to GAPDH (n = 5); **p = 0.009, t-test. Right, immunoblot of Src levels in Ch-UV non-tumourigenic skin of Pparβ/δ+/+ and Pparβ/δ−/− mice (n = 5). One of three independent experiments is shown. E  Representative pictures of Src immunohistochemistry in Ch-UV skin of 13Pparβ/δ+/+ and 9 Pparβ/δ−/− mice. Scale bars, 50 μm.
Figure 3
Figure 3
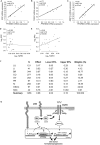
Src is a direct PPARβ/´ target gene. A  Schematic structure of the murine Src gene. Untranslated and translated exons of Src-001 transcript and position of primers used for 5′ RACE are depicted as indicated. GSP, gene-specific primer. B  Identification of the Src transcript isoform expressed in wild-type primary keratinocyte cultures treated with GW501516 (100 nM) for 24 h (lane 1) and total skin of SKH-1 wild-type mice after acute irradiation (lane 2). In both samples, a major 650-bp product was obtained. Sequencing of the isolated DNA bands indicated that the transcripts corresponded to the Src-001 transcript (ENSMUST00000029175). C  PPARβ/δ activity on wild-type or mutated PPREs in the Src promoter (supplementary Fig S5) via luciferase assays in NIH3T3 cells treated with GW501516 (300 nM) or vehicle (DMSO). Fold inductions were calculated as the ratio of firefly luciferase to Renilla luciferase activity using DMSO-treated NIH3T3 cells transfected with a TK-3PPRE construct designated as 1. Values are shown as the mean ± SD (n = 3).p-values are, from left to right, ***p = 0.0002, 0.0003, 0.0001, 0.0032, 0.0001, 0.0008 calculated by two-tailed Student's t-test. One of three independent experiments is shown. D,E  Representative results of ChIP experiments using anti-PPARβ/δ antibody (D) followed by re-ChIP with anti-p300 (E) performed in mouse keratinocytes (MKs) downregulated for PPARβ/δ expression by siRNA [knockdown cells (KD)] or not (wild-type cells, WT) treated or not with GW501516. The results show a PCR amplification of the PPRE3, 4 and 5 sites. Preimmune serum (p.i.) served as a control for ChIP. Primer sequences are given in supplementary Table S3. Data are representative of n = 3 independent experiments.
Figure 4
Figure 4
PPARβ/´-dependent upregulation of Src expression enhances EGFR/Erk1/2 signalling upon UV exposure in vitro and in vivo. A  Immunoblots of Src, pTyr845 EGFR, total EGFR, pErk1/2 and total Erk1/2 levels from whole-cell lysates of HaCaT cells transiently transfected with control (Ctrl), Pparβ/δ or Src siRNA, treated 24 h with GW501516 or DMSO, and then subjected to UVB radiation (40 mJ/cm2) before harvesting 30 min later. GAPDH was used as a loading control. Data are representative of three independent experiments. B,C  Immunoblot of pTyr845 EGFR, total EGFR, pErk1/2 and total Erk1/2 levels in protein extracts from chronically irradiated (Ch-UV) (B) or acutely irradiated (Ac-UV) (C) dorsal skin of Pparβ/δ+/+ and Pparβ/δ−/− mice. Data are representative of three independent experiments. D  Immunoblot of pTyr845 EGFR, total EGFR, pErk1/2 and total Erk1/2 levels from whole-cell lysates of HaCaT cells treated with the PPARβ/δ agonist GW501516 or DMSO for 24 h before UVB exposure (40 mJ/cm2) in the presence or absence of a Src family kinase inhibitor (PP2), and harvested 30 min later. Data are representative of three independent experiments. E  Real-time RT-PCR of Ets1 mRNA expression in non-irradiated and Ac-UV dorsal skin of Pparβ/δ+/+ and Pparβ/δ−/− mice. Data are representative of three independent experiments for 12 Pparβ/δ+/+ and 12 Pparβ/δ−/− mice; p-values are *p = 0.032, **p = 0.009 calculated by two-tailed Student's t-test.
Figure 5
Figure 5
Pharmacological inhibition of PPARβ/´ prevents UV-induced Src expression and Src-dependent activation of EGFR/Erk1/2 signalling in vivo. Dorsal skin of Pparβ/δ+/+ and Pparβ/δ−/− mice was topically treated with the PPARβ/δ antagonist GSK0660 or vehicle (Veh; 70% ethanol) prior to acute UV irradiation (Ac-UV); mice were sacrificed 24 h later. A–C  Quantification of Plin2 (A), Tgfβ1 (B) and Src (C) mRNA expression via real-time RT-PCR. Means ± SEM are presented (n = 6 mice/genotype/group). Data are representative of two independent experiments; p-values are *p = 0.0190, **p = 0.0066, ***p = 0.0004 for Plin2; *p = 0.0421, 0.0153 (from left to right) and **p = 0.0098 for Tgfβ1; *p = 0.0428, **p = 0.0098, ***p = 0.0045 for Src calculated by two-tailed Student's t-test; ns, not significant. D  Immunoblot of total Src, EGFR, p-Tyr845 EGFR, Erk1/2 and p-Erk1/2 protein in extracts from dorsal skin of Pparβ/δ+/+ and Pparβ/δ−/− mice. Data are representative of two independent experiments (n = 12 mice/genotype/experiment). E  Quantification of Ets1 mRNA expression by real-time RT-PCR. Means ± SEM are given (n = 6); p-values are *p = 0.0324 and **p = 0.0091, 0.082 (from left to right) calculated by two-tailed Student's t-test. F  Quantification of Pparβ/δ expression via real-time RT-PCR. Means ± SEM are presented (n = 6 mice/genotype/group). Data are representative of two independent experiments; p-values are **p = 0.0083 and ***p = 0.0006 calculated by two-tailed Student's t-test; ns, not significant.
Figure 6
Figure 6
PPARβ/´ upregulates pro-tumoural marker gene expression and laminin 332 deposition in actinic keratosis, enhancing SCC progression. A  mRNA expression of epithelial-to-mesenchymal transition (EMT) markers in 20 actinic keratoses with moderate atypia (grade II) of Pparβ/δ+/+ and Pparβ/δ−/− mice by real-time RT-PCR. Means ± SEM are presented; p-values are **p = 0.0077 (Tgfβ1), ***p = 0.0009 (Krt13), *p = 0.046 (Vim), *p = 0.045 (Snai1), *p = 0.032 (Snai2), *p = 0.028 (Gsc), **p = 0.009 (Itgαv), *p = 0.025 (Itgα6), *p = 0.022 (Itgβ1), *p = 0.013 (Itgβ6), *p = 0.035 (Cadh12), *p = 0.020 (Col7α1), *p = 0.035 (Mmp19), *p = 0.025 (Lamα3), *p = 0.043 (Mmp2) calculated by two-tailed Student's t-test. The full gene names are given in supplementary Table S2. B  Representative immunofluorescence staining of PLA experiments for laminin 332/β4 integrin (red spots) in actinic keratosis with moderate atypia (grade II) sections from Pparβ/δ+/+ and Pparβ/δ−/− mice. DAPI, blue. Scale bars, 50 μm. C  Representative immunofluorescence staining of PLA experiments for β4 integrin/Rac1 (red spots) and laminin 332 in actinic keratosis with moderate atypia (grade II) sections from Pparβ/δ+/+ and Pparβ/δ−/− mice. DAPI, blue. Scale bars, 50 μm. D  Quantification of PLA staining. Average number of PLA signals (red spots) per nucleus from n = 10 actinic keratoses with moderate atypia sections/genotype (*p = 0.024, t-test). E  Actinic keratosis (AK) with grading of cellular atypia (mild, grade I; moderate, grade II; severe, grade III) and SCC distribution in 25 tumours collected from each Pparβ/δ+/+ and Pparβ/δ−/− mouse graded histologically in a blinded manner according to Rowert-Huber et al and to the Broders' classification, respectively.
Figure 7
Figure 7
PPARB/D and SRC mRNA expression are correlated in human skin SCC and in other types of human carcinomas. A–C  Correlation between PPARB/D and SRC (A), PPARB/D and TGFB1 (B) and PPARB/D and MMP19 (C) expression as assessed via real-time RT-PCR of RNA extracted from human SCC biopsies (n = 9). p-values are calculated by two-tailed Student's t-test. D,E  Interaction between TGFB1 and PPARB/D underlies SRC expression levels. All 42 SCCs were sorted by PPARB/D expression. Samples with either the highest (n = 21; top 50% of the samples) or lowest (n = 21, bottom 50% of the samples) PPARB/D levels were identified. (D) Least squares regression between TGFB1 and SRC expression levels in samples with the lowest PPARB/D expression. The black line represents the least square fit. The observed linear regression coefficient (−0.23) was not significantly different from zero (Student p-value = 0.75). (E) Linear regression between TGFB1 and SRC levels in the 21 tumour samples with the highest PPARB/D expression revealed a significant linear relationship. F  Table presenting the interaction coefficient β3 (estimate) and its 95% confidence interval for the linear model SRC ∼ β0 + β1TGFB1SRC + β2PPARB/D + β3TGFB1SRC: PPARB/D. The summarized meta-analysis of the interaction coefficient was estimated using a random effects model. G  Model of the molecular function of PPARβ/δ in UV-induced skin tumours. UV irradiation induces PPARβ/δ gene expression and activation. Once activated, PPARβ/δ drives the expression of Src, which correlates with an increased Src protein level and higher kinase activity. This activity leads to the activation of the Src-dependent EGFR/Erk1/2 signalling pathway, which drives the expression of genes involved in the epithelial-to-mesenchymal transition (EMT). In coordination with other PPARβ/δ-dependent or -independent mechanisms and/or genetic defects, this mechanism enhances skin tumour formation and progression upon UV exposure, identifying PPARβ/δ as a putative inducer of carcinoma.

References

    1. Adhikary T, Brandt DT, Kaddatz K, Stockert J, Naruhn S, Meissner W, Finkernagel F, Obert J, Lieber S, Scharfe M, et al. Inverse PPARbeta/delta agonists suppress oncogenic signaling to the ANGPTL4 gene and inhibit cancer cell invasion. Oncogene. 2012 DOI: 10.1038/onc.2012.549. - DOI - PMC - PubMed
    1. Allalou A, Wahlby C. BlobFinder, a tool for fluorescence microscopy image cytometry. Comput Methods Programs Biomed. 2009;94:58–65. - PubMed
    1. Bissell MJ, Radisky D. Putting tumours in context. Nat Rev Cancer. 2001;1:46–54. - PMC - PubMed
    1. Bode AM, Dong Z. Mitogen-activated protein kinase activation in UV-induced signal transduction. Sci STKE. 2003;2003:RE2. - PubMed
    1. Boukamp P. Non-melanoma skin cancer: What drives tumor development and progression? Carcinogenesis. 2005;26:1657–1667. - PubMed

MeSH terms